
By Michon Scott
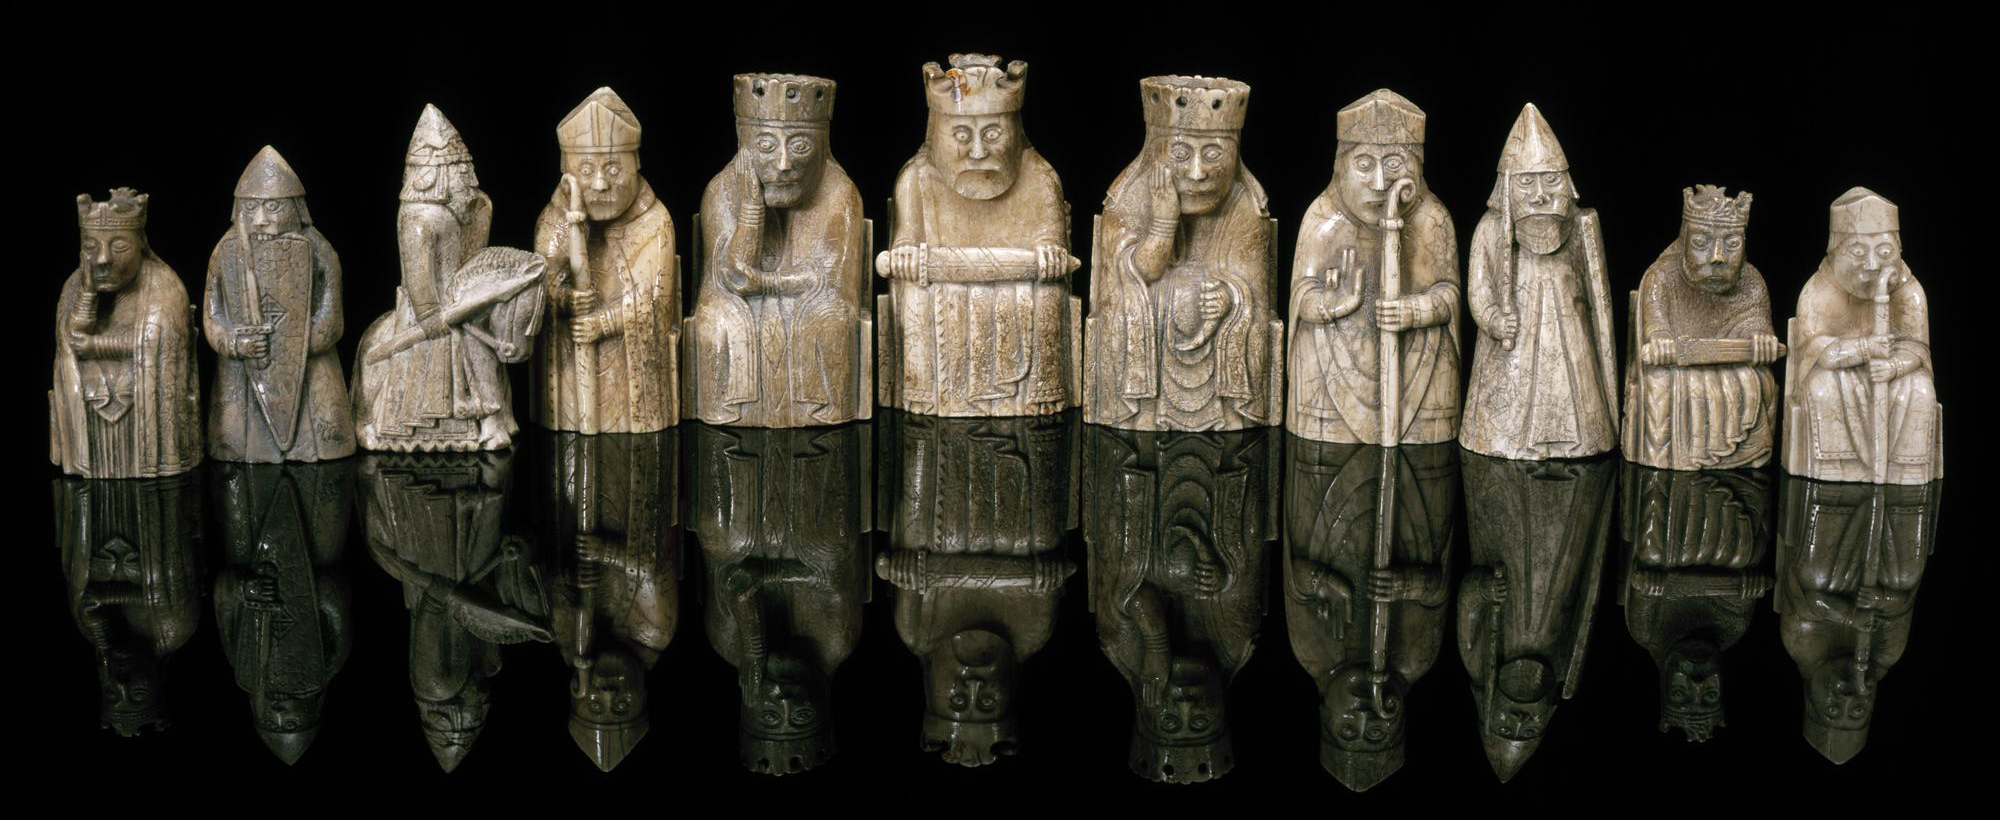
Credit for image above: Wikimedia UK and the National Museum of Scotland
The Lewis Chessmen, on display at the British Museum and the Museum of Scotland, peer with medieval mystique at visitors. While their exact origins are obscure, historians estimate the pieces were carved in Norway or Iceland sometime in the twelfth century.
That would make them centuries younger than the oldest observations archived by NOAA@NSIDC.
The Global Lake and River Ice Phenology Database (G01377) includes observations dating back to the ninth century. The oldest observation in the database was taken during the Northern Hemisphere winter of 874 to 875 at Lake Constance, and the record indicates that, yes, the lake froze. The next observation of Lake Constance freezing was recorded 20 years later, during the winter of 894 to 895. Whether the 20-year gap between freezing records is down to a dearth of observations or a series of warm winters is tricky to determine now. More observations of Lake Constance ice cover entered the historical record—occasional status reports from the eleventh through nineteenth centuries. Beginning in the winter of 1962 to 1963, observations recurred each year. The lake froze that winter, but as of 2020 it had not frozen over again.
— Credit:
Vacances_1050/Flickr
A younger but more consistent record on lake freezing survives for Lake Suwa in Japan. Beginning in 1443, Shinto priests recorded ice formation annually because it was important to their religious observations. Well into the twenty-first century, they continued to record lake freezing conditions nearly every year.
— Credit:
Kzu06/Wikimedia Commons
Across the Northern Hemisphere, people recorded observations as they needed them, probably not anticipating how useful those records might prove centuries later. Yet these observations constitute one of the longest records of climate observations acquired through direct human observation.
Ease of access to a rich record
Altogether, the Global Lake and River Ice Phenology Database, contains freeze dates, thaw dates, and other ice cover observations for 865 water bodies across the Northern Hemisphere. More recent observations have been taken on a regular basis, and include records with additional detail, such as specific dates of ice formation and thaw.
Lake Constance is an outlier in its record longevity, but the database does contain other expansive records. It includes 542 water bodies with observation records exceeding 19 years, 249 of them with records longer than 50 years, and 66 of them with records over a century.
The database also offers a handy online query tool, which lets users select records based on latitude and longitude, country, and/or water body name. Users can then customize output fields and sort records as desired. The tool can display results in the browser, or in downloadable comma- or tab-separated text files.
— Credit:
NSIDC
Lasting scientific value
The Global Lake and River Ice Phenology Database was assembled after a 1996 workshop sponsored by the Center for Limnology at the University of Wisconsin-Madison. The newly formed team of international scientists—the Lake Ice Analysis Group—wanted to uncover trends in lake and river freezing and thawing not available from shorter-term records.
Comparing observations from different locations and at different times means establishing consistent methods for assessing freezing and thawing across data records, and considering the individual quirks and methodology changes that could affect observations. Taking such considerations into account, the data record becomes enormously valuable. It enables scientists to discern patterns in seasonal freezing and thawing, as well as change over time.
Early on, studies based on the database enabled researchers to compare lake and river conditions at state-, country-, and hemisphere-wide scales. Multiple studies derived from the database have detected signals of climate change, which has accelerated since the twentieth century.
Reference
Benson, B., J. Magnuson, and S. Sharma. (2000). Global Lake and River Ice Phenology Database, Version 1 [Data Set]. Boulder, Colorado USA. National Snow and Ice Data Center. https://doi.org/10.7265/N5W66HP8. Accessed January 18, 2023.


