

Freshwater is a key feature of the terrestrial environment, which is inevitably linked to life on Earth and essential for flourishing societies. Consequently, freshwater use has been identified as a planetary boundary which constitutes a ‘safe operating space for humanity’15, 16. Although there is emerging evidence that global human water use is exceeding sustainable limits17, 18, the question whether anthropogenic climate change is detectable in freshwater resources at continental to global scales remains largely unanswered19. To date, only a few studies have employed formal detection and attribution techniques showing that climate change has affected the seasonality of river flow in the western United States2, 3 and river discharge in the Mahanadi River Basin in India4. However, as river flow is a regional phenomenon that depends on a complex interplay between atmospheric forcing and multiple terrestrial processes, the results cannot be transferred to other regions. Therefore, although these studies2, 3, 4 are of regional relevance, they do not allow one to conclude that similar climate change impacts are emerging at other locations or at continental to global scales. Additionally, the results for the western United States2, 3 are for detection of changes in seasonality rather than changes in total water volumes.
To approach the question whether effects of anthropogenic climate change are detectable in changes of renewable freshwater resources at the continental scale, we analyse a recent collection of pan-European river-flow observations8. River and streamflow are regularly used indicators for renewable freshwater resources12, 13, 20 and are arguably the best-monitored variables of the terrestrial water cycle8, 21. Consequently, the considered observations8 constitute an ideal basis for assessing possible impacts of anthropogenic climate change on continental-scale renewable freshwater resources.
Figure 1a shows trends in observed annual runoff rates of stations that were assigned to a regular grid to match climate model output. The analysis indicates drying trends in the Mediterranean region and weak wetting trends in northern Europe, which is in line with previous assessments10, as well as projections of water availability under climate change5, 14. The North Atlantic Oscillation22 (NAO) is dominating natural climate variability in Europe and known to have a significant impact on precipitation and river flow23, leaving the question whether it influences the observed trend pattern. In fact, removing the first-order effects of the NAO from observed runoff reduces the trend magnitude (Fig. 1b). Nevertheless, the trends still exhibit a clear spatial pattern, with drying trends in the south and weak wetting trends in the north. Regional decadal mean time series of observed runoff rates (Fig. 2) confirm the general pattern of a drying in the south and a weak wetting tendency in the north, which is consistent with observational changes in drought risk that are linked to global warming24.
a,b, Trends are estimated for raw annual runoff observations (a) as well as for runoff observations from which the first-order effect of the North Atlantic Oscillation (NAO) has been removed (b). Trends are expressed in units of standard deviation per decade. Stippling indicates local significance of the trend estimates using an adjustment that ensures that the false-discovery rate is not larger than 0.1. If the fraction of locations with significant trends (Runoff: 0.17, Runoff (NAO removed): 0.07) is larger than 0.1 then the spatial trend pattern is declared field significant. Three predefined pan-European macro-regions5, corresponding to northern Europe (NEU), central Europe (CEU) and the Mediterranean (MED), that are used for subsequent analysis are shown in a.
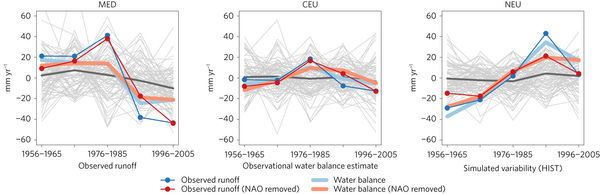
Decadal mean regional averages for the three pan-European macro-regions (see Fig. 1). Points and lines depict observational runoff anomalies as well as observed runoff anomalies with the effect of the NAO removed. Thick lines show reconstructions of regional runoff anomalies that are based on a climatological water balance model (CWBM). Grey lines show individual climate model simulations that account for historical radiative forcing (HIST), as well as the mean of all simulations (black line).
Beside changes in atmospheric water supply (precipitation) and demand (factors influencing evapotranspiration), human management including land cover change25, large-scale irrigation18, 26 or the construction of reservoirs and dams18, 27, could also contribute to the observed change. As these are complex processes that include human decisions, they require an independent assessment. Nonetheless, runoff reconstructed with a climatological water balance model (CWBM), that does not require observed runoff for calibration, confirms that a large fraction of the observed spatio-temporal variance of European runoff can be explained by observed decadal mean precipitation (P) and potential evapotranspiration (Ep) (R2 = 0.82, p < 0.001; if NAO is removed: R2 = 0.72, p < 0.001; Fig. 2). The CWBM underestimates the amplitude in the Mediterranean, hinting at the relevance of factors other than P and Ep. These factors can include both additional climatic controls (for example, seasonality, frequency of wet days28, factors translating potential to actual evapotranspiration29) as well as effects of landscape characteristics or human activities.
As the drying in the south and the wetting in the north of Europe can be explained by observed atmospheric variability, and is consistent with changes in meteorological drought risk24 as well as with future freshwater projections5, 14, we hypothesize that it includes a climate change component associated with anthropogenic greenhouse gas forcing. To test this hypothesis, we employ the detection and attribution approach1, 7 and compare observations with the expected response of the climate to external (anthropogenic) forcing as simulated by climate models. More precisely, we compare the observed regional mean decadal time series with equivalent series derived from historical climate model simulations9 (HIST) that are forced with anthropogenic (that is, greenhouse gas and aerosol emissions) as well as natural radiative forcing (for example, volcanic and solar forcing). If the mean response of the HIST simulations is consistent with observed change, and if the observed change is unlikely to be caused by natural climate variability, it is possible to conclude that a response to the historical forcing has been detected. Natural climate variability is estimated using pre-industrial control simulations—that is, century- to millennium-long climate model simulations with greenhouse gas levels set to pre-industrial conditions9 (CTL). Finally, we also consider simulations that account only for natural historical forcing (NAT)—that is, climate model simulations for the twentieth century with only natural radiative forcing and no human emissions—to determine whether natural radiative forcing can offer an alternative plausible explanation for the observed change pattern. Figure 2 shows beside the observations also the ensemble of HIST simulations together with their mean. The scatter of the HIST simulations generally encompasses the observed time series, indicating that the ensemble captures the stochastic nature of natural climate variability in a reasonable manner. The spatio-temporal pattern of the mean of the simulations also weakly hints at a tendency of drying in the south and wetting in the north of the continent. However, the amplitude of the simulated mean pattern is well below the amplitude of the observations. The larger amplitude of the observed pattern could be related to natural climate variability or to the possibility that the climate models underestimate the true response to human emissions (consistent with previous analyses of zonal precipitation30). Furthermore, it is important to recall that state-of-the-art climate models generally do not account for on-the-ground human interventions in the water cycle, which could be substantial25, 26, 27 and might also contribute to the underestimation of the observed change. Note, however, that a comparison to regional mean time series that were estimated using the CWBM (Fig. 2), and are hence not affected by on-the-ground human influence, also suggests that the global climate models underestimate the response.
To allow for a quantitative assessment, a correlation analysis of the observations and the mean HIST and NAT simulations is conducted (Fig. 3a). The mean of all HIST simulations is highly correlated with the observed pan-European space-time pattern as well as with the Mediterranean and northern European time series. Moreover, these correlations are larger than the 90th percentile of correlations between the observations and a large ensemble of CTL simulations. Hence state-of-the-art climate model simulations suggest that it is highly probable that the observed pattern is captured only if the models are forced with human emissions. This general feature does not change if first-order effects of the NAO are accounted for, with the exception that correlations in NEU are only larger than the 80th percentile of the CTL simulations. Furthermore, correlations between observations and the mean of all NAT simulations are low, and well within the range spanned by CTL, implying that it is unlikely that natural radiative forcing is causing the observed change pattern. In central Europe, which constitutes a transitional zone between drying in the south and wetting in the north, both the observations and the simulations show no clear change. As both the observations and the simulations are affected by internal climate variability (that is, climate noise), the correlations are as expected low and indistinguishable from the correlations of the observations with CTL. In summary, the correlation analysis shows that climate models capture the observed pan-European space-time dynamics as well as the Mediterranean and northern European change patterns only if effects of human emissions on the climate are considered.
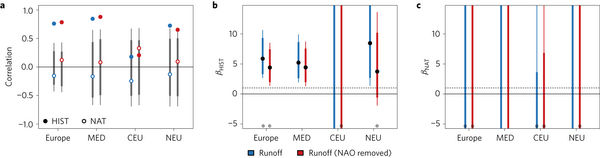
a–c, Shown are results for the entire continent (Europe) as well as for the three sub-regions (see Fig. 1). The analysis is conducted based on regional averaged decadal runoff anomalies as well as on runoff anomalies with the effect of NAO removed. For the European assessment, the time series of the three sub-regions are merged into one large vector prior to any computation. a, Pearson correlation coefficients between observed runoff anomalies with the mean anomalies of historical (HIST, dots) and natural (NAT, circles) simulations—compared to the range between the 10th and the 90th (thin line) as well as the 20th and the 80th (thick line) percentile spanned by correlating observed anomalies with pre-industrial control simulations (vertical bars). Detection is claimed if the correlations with either HIST or NAT exceed this range. b, Scaling factors (black dots) and 10% to 90% (thin lines) as well as 20% to 80% (thick lines) confidence intervals obtained from the regression-based optimal detection analysis for HIST. Asterisks indicate that a residual consistency test is not passed at the 90% confidence level in at least 10% of the statistical simulations. Detection can be claimed if the lower confidence bound is above zero (solid horizontal line). If the confidence interval covers one (dashed horizontal line) then the scaling factor is statistically indistinguishable from unity. This indicates that the amplitude of the mean response is consistent with the observations, given the uncertainty imposed by natural climate variability. c, Same as b but for NAT.
Although the correlation analysis suggests that the observed spatio-temporal pattern is captured by climate models only if human emissions are considered, the difference in the amplitude between the observations and the mean of all HIST simulations remains to be quantified. Therefore, and to corroborate the results, observations and model simulations are compared using regression-based optimal fingerprinting1, 7. For this, it is assumed that the relation between observations and historical simulations can be described as OBS = β × (MOD + η) + ε, where MOD is the mean of either HIST or NAT and η denotes the sampling uncertainty of MOD due to limited ensemble size. The scaling factor β is used to scale MOD such that it matches the observed long-term change. The term ε denotes natural internal climate variability and is estimated from CTL. If the scaling factor (β) is significantly larger than zero, it can be concluded that the simulated response is detectable in the observations. If the scaling factor is indistinguishable from one, the simulated response is consistent with the observations. In this analysis, the scaling factors of the pan-European space-time pattern and the Mediterranean time series are significantly different from zero (≥90% probability) only if anthropogenic emissions are considered in the climate model simulations (Fig. 3b). This is consistent with the correlation-based assessment (Fig. 3a), and thus strengthens the evidence that human emissions are amplifying the north–south contrast in European freshwater availability, with particular impact in the Mediterranean. Note, however, that the best estimates of the scaling factors are about five, and significantly larger than one, confirming that the models significantly underestimate the amplitude of observed change. In northern Europe, the regression-based approach detects anthropogenic influence in the original time series, but not after the effect of NAO is removed.
A supplementary assessment (Supplementary Section 1), that repeats the detection analysis on the runoff time series reconstructed by the CWBM, confirms the correlation-based results at the 90% confidence level for both the pan-European case and the Mediterranean. However, the statistical confidence is reduced to the 80% level for northern Europe and for the regression-based test. Possible reasons for the reduced confidence include uncertainty in the atmospheric data used for water balance modelling and the fact that the CWBM considers only effects of mean annual precipitation and potential evapotranspiration, leaving the influence of other climatic factors (for example, seasonality28, storm arrival rate28, the translation of potential evapotranspiration in actual evapotranspiration29) and possible impacts of human land management18, 25, 26 unaccounted for. Note, however, that the general finding that an increasing gradient between drying in southern Europe and a tendency to wetting in northern Europe is linked to human effects on the climate is consistent with previous assessments, showing that increasing precipitation in high latitudes30 and changes of drought risk in Europe24 are associated with anthropogenic climate change.
In summary, the presented results show that there is a high probability (≥90%) that an anthropogenic climate change signal amplifying the north–south contrast of runoff at the continental scale in Europe is detectable in observations. The signal is particularly driven by the increasingly dry conditions in southern Europe, whereas the change in the north is less pronounced. In central Europe, the transition region from a decrease to an increase, there is little change. Considering observational and model uncertainty, the latter manifesting itself in the pronounced difference in the amplitude of observed and multi-model mean space-time series (Fig. 2), the fact that land-management impacts cannot be fully excluded, and the reduced confidence in the supplementary detection analysis, we assess that the detected space-time pattern is thus likely (≥66% probability6) attributable to human emissions. Considering that runoff is an important indicator of renewable freshwater resources11, 12, 13, the results highlight the relevance of climate projections that indicate increased water scarcity in the Mediterranean region5, 14 under climate change. Therefore, the presented results point to the need of raising awareness of the possible consequences of anthropogenic climate change for regional water resources in the already water-scarce south of Europe.


