
GREENVILLE – A 90-day appeal or protest period began this week in some coastal counties for proposed new National Flood Insurance Program rate maps, which officials say provide greater accuracy for determining premiums despite no consideration given to the effects of sea-level rise.
The appeal period for preliminary floodplain mapping in Carteret, Pamlico and Dare counties began Wednesday and ends Nov. 13. For Onslow, Hyde, Jones, Craven, Tyrrell and Beaufort counties the period began Thursday and ends Nov. 14.
The appeal period is a time set aside for community officials and property owners to formally object to information shown on the preliminary Flood Insurance Rate Map, or FIRM. The FIRM panels depict new or revised base flood elevations, or the level to which floodwater is anticipated to rise, according to North Carolina Floodplain Mapping Program website.
Preliminary maps for the nine coastal counties were released June 30, 2016. The maps were based on a new coastal flood study that includes updates to the 1 percent annual chance storm surge values, as well as the expected erosion analysis and studies of overland wave effects these rare storms produce.
Brunswick, New Hanover and Pender counties preliminary flood hazard data were released Aug. 29, 2014, with the 90-day appeal period that began October 2015 and ended in January 2016. The effective date is anticipated to be later this year. Preliminary maps for Camden, Chowan, Currituck, Pasquotank and Perquimans counties were issued November 2015 with the 90-day appeal period having begun in July 2016. Those maps are to take effect next spring.
North Carolina partnered with the Federal Emergency Management Agency, or FEMA, to produce the updated FIRMs so that property owners could better understand their flood risk. Depending on the risk to a building, flood insurance may be required as a condition of obtaining a federally secured loan. Other times, purchasing flood insurance is considered a wise investment in preventing the financial devastation flooding brings, the website continued.
John Dorman is director of the North Carolina Floodplain Mapping Program, which began in 2000 after Hurricane Floyd took place in 1999. Dorman gave an update on the current status of the state’s coastal floodplain mapping during a July meeting of the Coastal Resources Commission in Greenville.

John Dorman
“As you know, flooding is probably the greatest hazard that we have in the state of North Carolina,” Dorman said.
Dorman said that every three and a half years his office determines which flood studies, whether for riverine or coastal areas across the state, need to be updated.
“There are about 40,000 stream miles that are looked at every three and a half years,” he added. They have collected information and used technology to collect the first-floor elevation of each of the 5.2 million buildings in the state in the 100-year flood zone. The 100-year flood is a flood event that has a 1 percent probability of occurring in any given year.
“We can subtract the difference of the first floor from the water level of the storm and tell you how much the damage will be on that building,” he said. “Based on damage curves, we calculate the financial cost to replace or repair that building.”
He said this was a significant benefit during hurricane Matthew. “Even before the end of the storm, we were able to tell FEMA what the financial cost was going to be for North Carolina.”
Dorman continued that FEMA utilizes the maps that his office maintains and updates. FEMA, along with flood determination companies and the insurance community, decides which buildings are required to buy federal insurance, based on federal requirements, adding that typically any federally backed mortgage requires insurance if it’s in the 100-year flood zone.
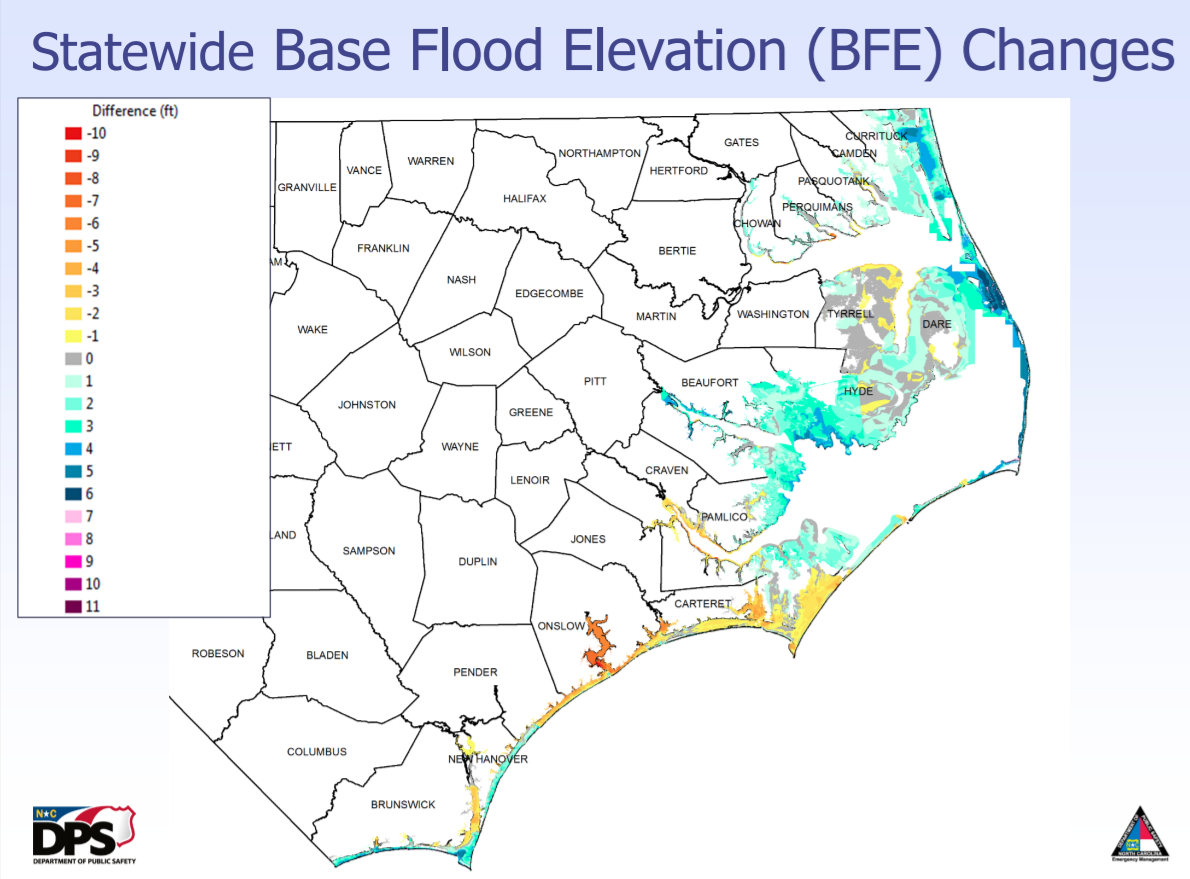
The new maps include revised base flood elevations. Source: N.C. Floodplain Mapping Program
“Since we started the program, we’ve collected LiDAR (Light Detection and Ranging) topography across the state. We believe this has allowed mapping to be much greater accuracy,” he said.
“Now specifically on coastal,” Dorman said, “Back in 2006, we started looking at coastal models and studies that were out there. We felt at that time we need to update the coast. … We utilize all of FEMA’s coastal requirements and standards in doing these studies. We also utilize private sector licensed professionals, engineers and surveyors.”
He added that much of all the modeling undergoes significant review and evaluation and the most up-to-date coastal hydrodynamic process and methodology based FEMA’s latest models are used.
“The current maps that were out there prior to the work we’ve done were based on 1981,” he explained. “The concern of ours was that the data was significantly out dated, the topography was very course; our desire and what we felt like was our duty was to update the coastal areas.”
Dorman noted that the question about climate change had come up a number of times.
“Nothing of what we’ve done with base-flood elevations has anything to do with climate change or sea-level rise,” he said. “That has not been built into this, in fact, it should be noted that FEMA is prohibited at this point in time from actually incorporating climate change or sea-level rise.”
Dorman said the entire coastline should be restudied, and FEMA agreed. They provided funding to update the whole coastline, which was done so there were no breaks in the work, overlaps or duplication.
“So why did we do an update?” he asked. “The last study was based on 1981 and significant changes have occurred since then. “We’ve had significant storms … and the last model that was used was not being maintained or accepted by FEMA. We could not update the coastal study with updated storm surge based on that existing model.”

The revised maps also incorporate new data on storm surge. Source: N.C. Floodplain Mapping Program
Additionally, the model used from 1981 did not include wave setup, or the increase in water level cause by the onshore movement of water from breaking waves.
“So, it may bring in surf, but it did not look at the increased elevation of the water based on the inability for it to run off,” Dorman said.
The study also updated topography and bathymetry data, or the measurement of depth of water in oceans, seas or lakes.
So, where are we now? Dorman asked. After the 90-day appeal period is over, it’s believed that all the maps will be adopted and all the issues will be managed.
“By spring of 2018 those counties will be effective for insurance rating purposes. Those maps can be used right now by the community for properties with higher elevations,” he said.
Community Development Planner Randy Mundt also addressed the CRC. With the program since 2006, he has been responsible for working with communities to determine where they have needs for updates and, if updates are necessary, working through the process from start to finish.
Mundt said the big picture is that though we always hear of the 100-year flood map, he feels it’s a misnomer.
“I don’t like having to use it, but for people to quickly understand that it means it’s not something that happens on a regular basis. Technically it’s the 1 percent annual chance flood, which is a significant, extreme event,” he explained. “A better way to look at where you’ll see the 1 percent annual chance would be where you experience, in this case, we’re looking at modeling.”
Mundt added, “If you can remember one thing, the 1 percent annual chance storm is an exceeding rare significant event that we may not in our lifetime experience.”
Learn More
Like This Story?
It costs about $500 to produce this and all other stories on CRO. You can help pay some of the cost by sponsoring a day on CRO for as little as $100 or by donating any amount you’re comfortable with. All sponsorships and donations are tax-deductible.


