
Between its east and west ice sheets and its peninsula, Antarctica holds enough ice to raise global sea levels by around 60m.
The West Antarctic ice sheet (WAIS) is a relatively small part, containing an amount of ice equivalent to 3.3m of sea level rise. Yet, most of it sits in a precarious position and is considered “theoretically unstable”.
As a result, how the WAIS will change in response to human-caused warming is generally thought to be the largest source of uncertainty for long-term sea level projections.
This article is part of a week-long special series on “tipping points”, where a changing climate could push parts of the Earth system into abrupt or irreversible change
- Explainer: Nine ‘tipping points’ that could be triggered by climate change
- Guest post: Could the Atlantic Overturning Circulation ‘shut down’?
- Guest post: The irreversible emissions of a permafrost ‘tipping point’
- Guest post: Could climate change and deforestation spark Amazon ‘dieback’?
- Guest post: How close is the West Antarctic ice sheet to a ‘tipping point’?
- Guest post: How close is the West Antarctic ice sheet to a ‘tipping point’?
The most pressing aspect of this uncertainty is understanding whether instability thresholds of ice have been crossed, whether the retreat we are now measuring is destined to continue, and whether ice that appears unchanging today will remain that way in the future.
The latest research says that the threshold for irreversible loss of the WAIS likely lies between 1.5C and 2C of global average warming above pre-industrial levels. With warming already at around 1.1C and the Paris Agreement aiming to limit warming to 1.5C or “well-below 2C”, the margins for avoiding this threshold are fine indeed.
Marine ice sheet
According to the recent special report on the ocean and cryosphere (SROCC) by the Intergovernmental Panel on Climate Change (IPCC), there are two main controls on how much global sea levels will rise this century: future human-caused greenhouse gas emissions and how warming affects the Antarctic ice sheet. The IPCC says:
“Beyond 2050, uncertainty in climate change induced SLR [sea level rise] increases substantially due to uncertainties in emission scenarios and the associated climate changes, and the response of the Antarctic ice sheet in a warmer world.”
The concern around the vulnerability of the WAIS principally lies in something called “marine ice sheet instability” (MISI) – “marine” because the base of the ice sheet is below sea level and “instability” for the fact that, once it starts, the retreat is self-sustaining.
Ice sheets can be thought of as huge freshwater reservoirs. Snow accumulates in the cold interior, slowly compacts to become glacier ice and then begins to flow like a very thick fluid back toward the ocean.
In some places, the ice reaches the coast and floats on the ocean surface, forming an ice shelf. The boundary between ice resting on the land surface (or the sea floor in the case of a marine ice sheet) is called the “grounding line”. The grounding line is where water stored in the ice sheet returns to the ocean. And when it moves seaward, we say the ice sheet has a positive “mass balance” – that is to say, it is gaining more ice mass than it is losing back to the sea.
But when the grounding line retreats, the balance is negative. A negative ice sheet balance means a positive contribution to the ocean and, thus, to global sea level.
Instability
This basic picture of ice sheet mass balance is all you need to understand why glaciologists are concerned about MISI.
Changes to the ice shelf on the floating side of the grounding line – such as thinning – can cause ice on the grounded side to lift off from the seafloor. As this ice floats, the grounding line will retreat. Because the ice flows more rapidly when it is floating than it does when grounded, the rate of ice flow near the grounding line will increase. Stretching caused by the faster flow becomes a new source of thinning near the grounding line.
This is illustrated in the figure below. As the newly floating ice flows and thins more quickly, it can cause more ice to lift off and float, driving the grounding line back.
In addition, the areas of the ice sheet at risk of MISI have a reverse, or “retrograde” gradient, which means it gets deeper further inland. As the grounding line retreats further into thicker parts of the ice sheet, the flow speeds up, further increasing ice loss. The reverse gradient makes this process self-sustaining as a positive feedback loop – this is what makes MISI an instability.
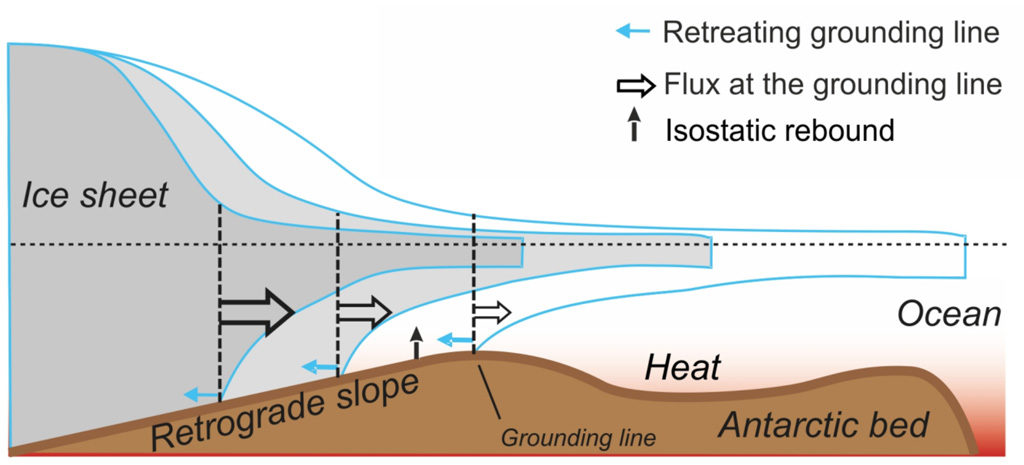
Illustration of Marine Ice Sheet Instability, or MISI. Thinning of the buttressing ice shelf leads to acceleration of the ice sheet flow and thinning of the marine-terminated ice margin. Because bedrock under the ice sheet is sloping towards ice sheet interior, thinning of the ice causes retreat of the grounding line followed by an increase of the seaward ice flux, further thinning of the ice margin, and further retreat of the grounding line. Credit: IPCC SROCC (2019) Fig CB8.1a
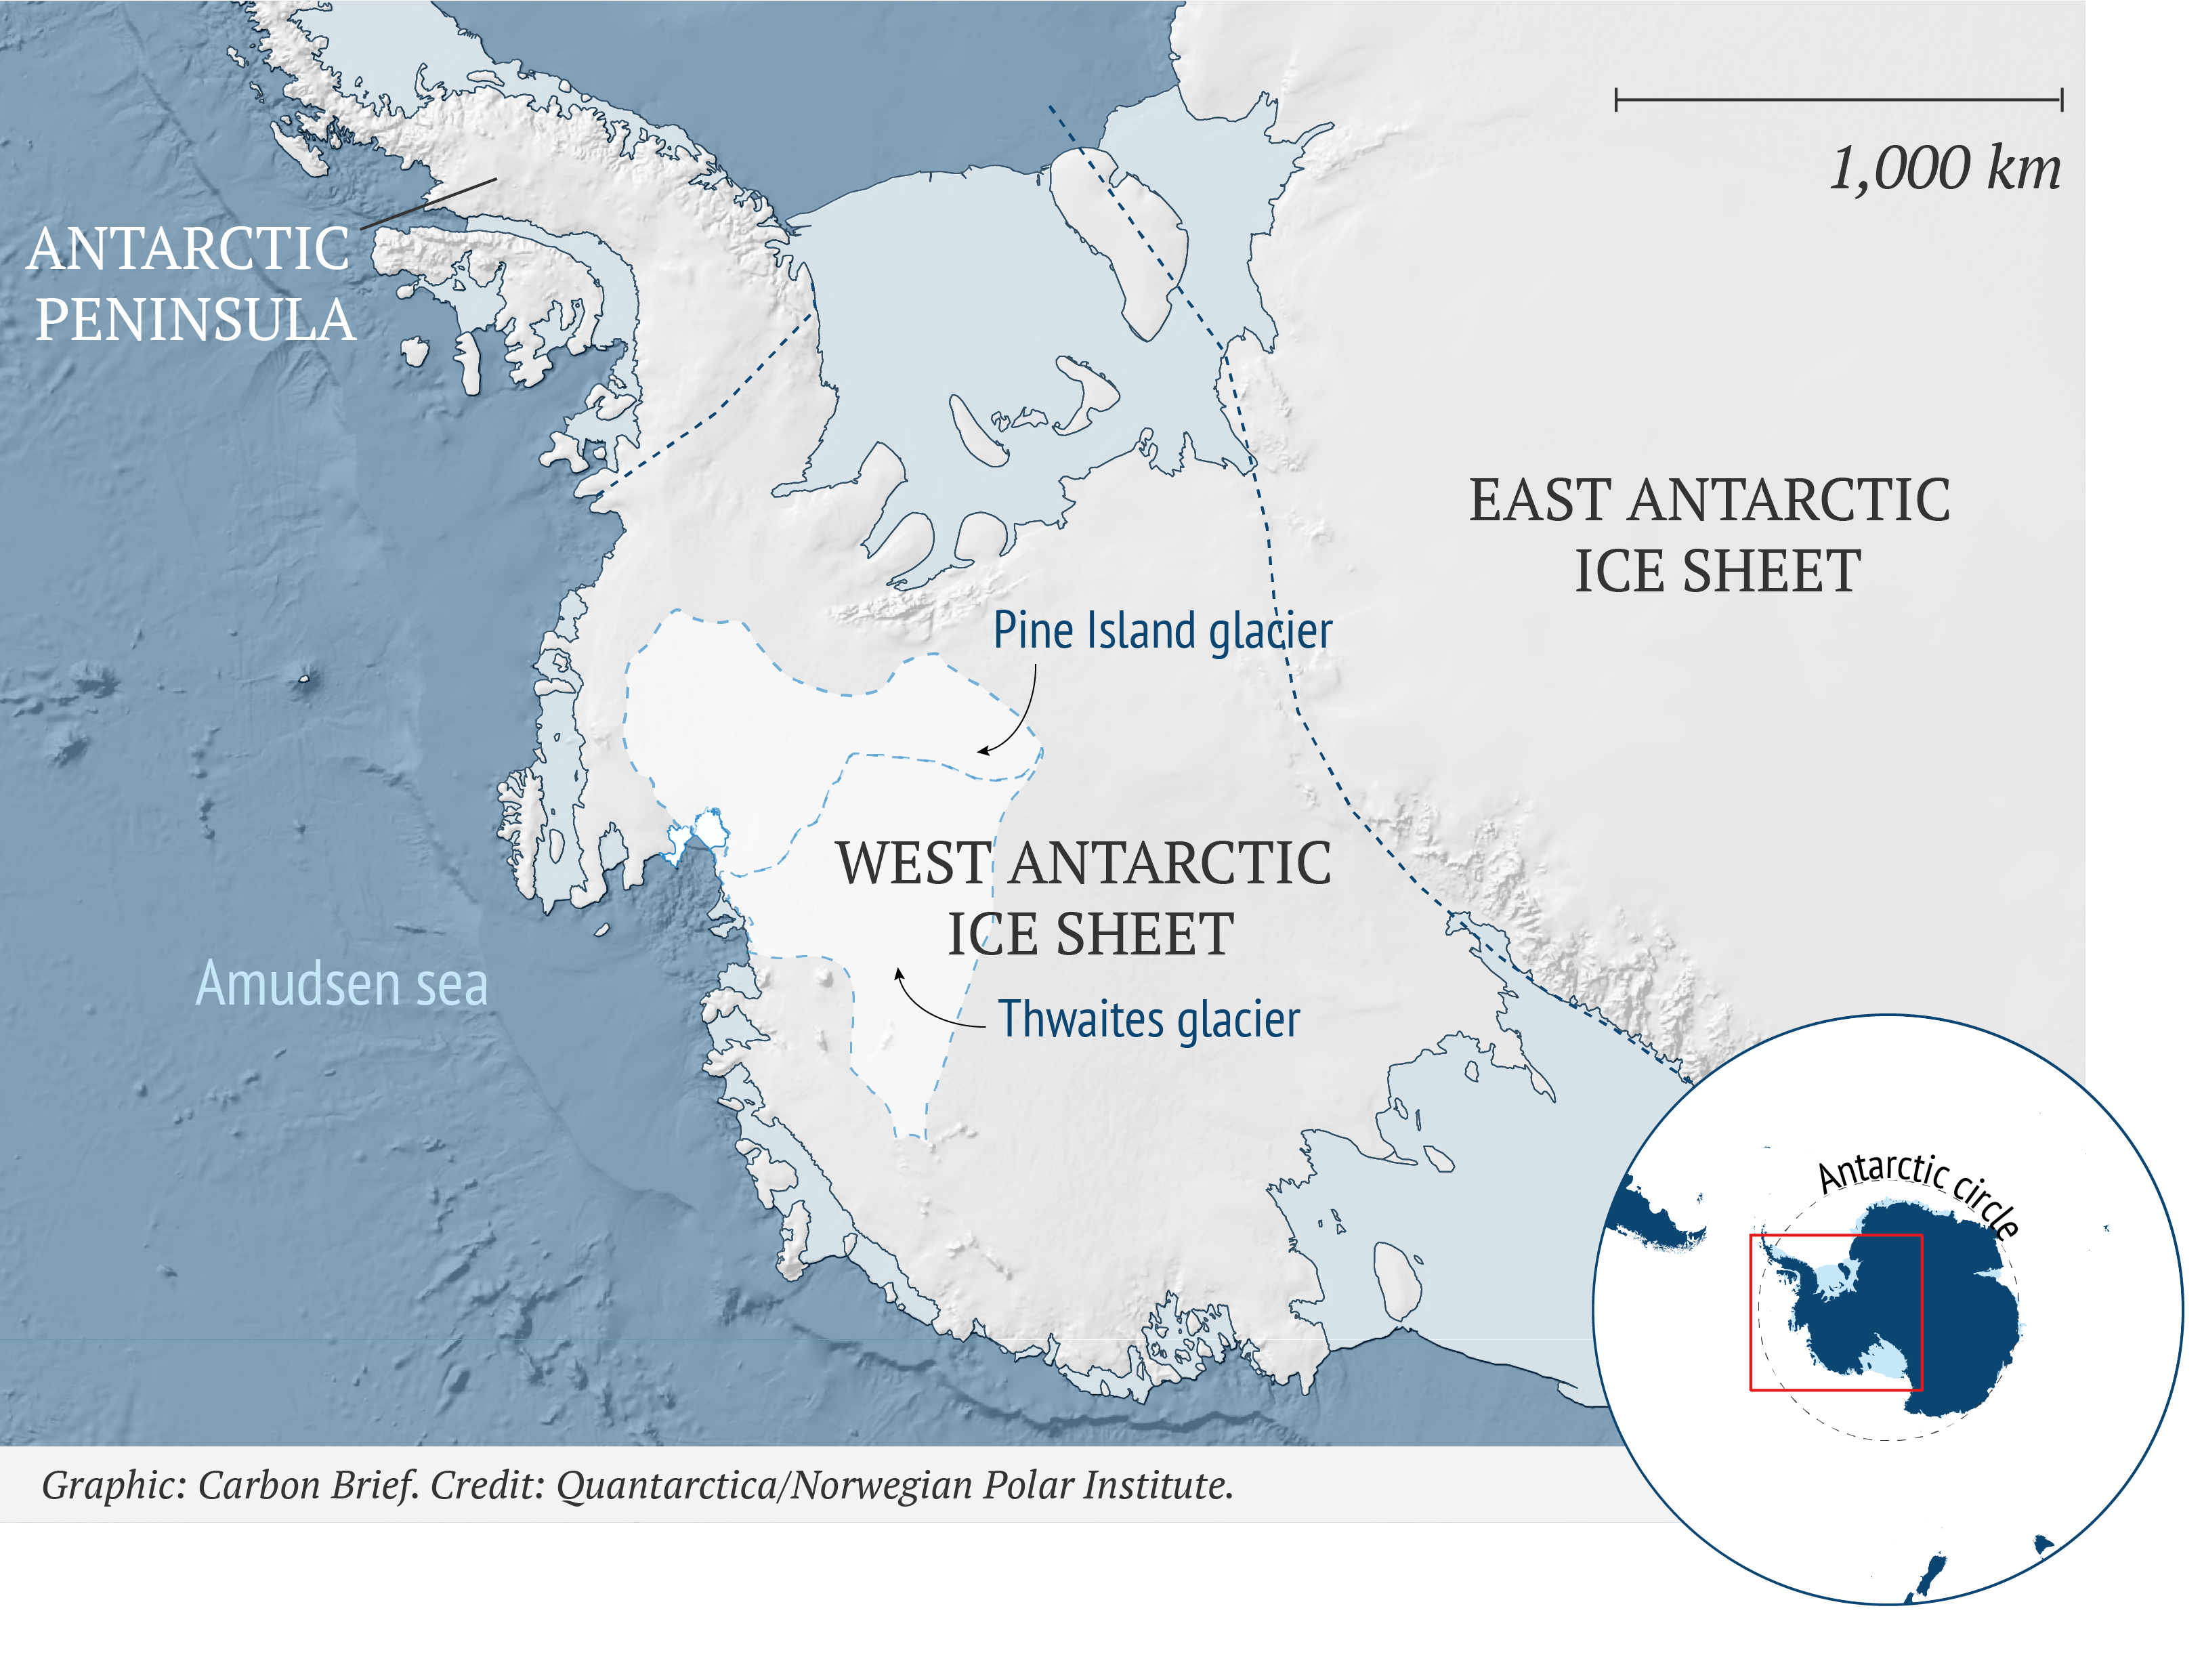
It is not clear yet if the MISI threshold has been crossed anywhere in Antarctica. We do know that grounding lines are retreating along the Amundsen Sea coastline – most spectacularly on the Thwaites Glacier. And the driver for the retreat appears to be relatively warm ocean water – about 2C warmer than the historical average – flowing toward the grounding line and causing stronger than usual melting.

1,000 km
Antarctic
peninsula
Ronne ice shelf
East Antarctic
Ice Sheet
Pine Island glacier
South pole
West Antarctic
Ice Sheet
Transantarctic mountains
Amudsen sea
Thwaites glacier
Ross ice shelf
Graphic: Carbon Brief. Credit: Quantarctica/Norwegian Polar Institute.
If the instability has not started and if the ocean warming stops, then the grounding line should find a new balancing point at a new location. But if it has started, then the retreat will continue no matter what happens next.
Faster flow
Even if the threshold has been crossed – or even if it is crossed in the future – the retreat can proceed at different rates depending on how hard we were “pushing” when it started.
Here’s how that works. The instability depends on a balance of forces within the ice sheet. A force due to gravity causes the ice to flow at a speed that depends in part on its thickness and its surface slope.
A larger melt rate on the floating side and faster flow across the grounding line will draw down the surface of the ice more quickly than smaller rates will. The faster draw-down generates a steeper surface slope and, thus, faster flow and faster retreat.
A modelling study of this feedback, published last year, found that when MISI started with a larger push (a larger melt rate), it proceeded more quickly than when it started with a smaller push, even after the extra melting was removed.
This means that even if MISI is invoked, cutting global emissions and slowing warming will give more time to get ready for its consequences.
Ice cliffs
There appears to be a second source of instability for marine ice sheets – one that comes into play if the ice shelves are lost entirely.
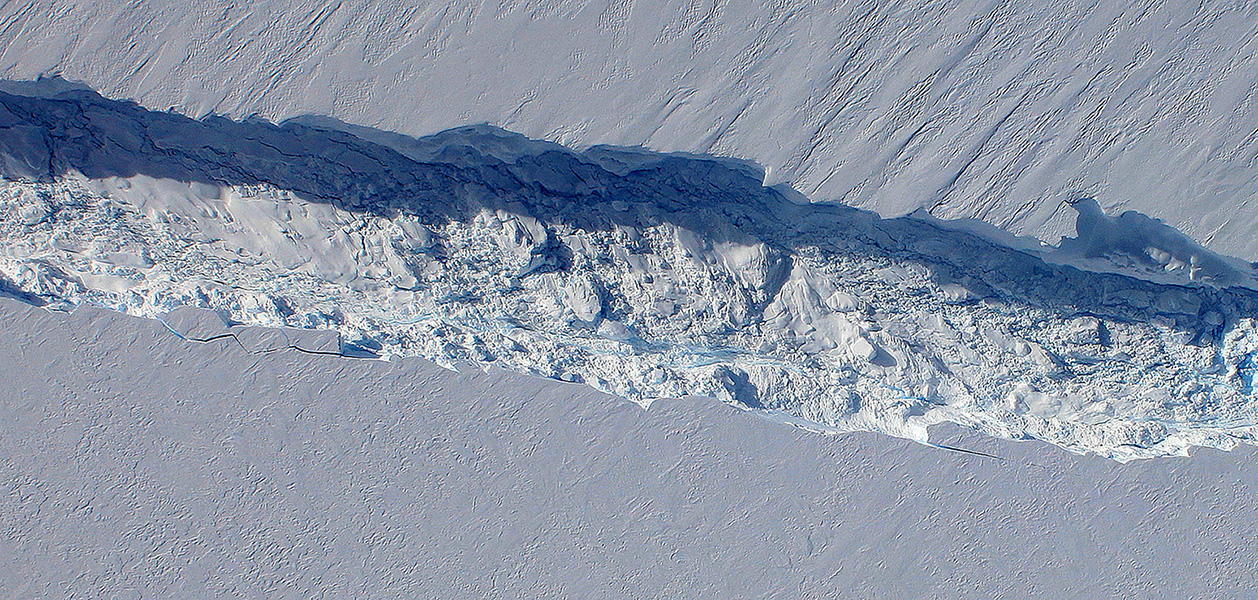
Some of the most spectacular images of glacier change are of iceberg calving – in other words, breaking off – from the heavily crevassed fronts of marine-terminating glaciers.
This calving is caused by melting of the underside of the ice shelf, as well as “hydro-fracturing” – where meltwater forming on the surface of the ice shelf seeps into the ice and causes cracking – or a combination of the two.
How quickly calving happens depends on the height of the ice cliff face above the waterline – the higher the cliff stands above the water, the larger the calving rate.
As is the case for MISI, the declining gradient of seafloor beneath the WAIS means that as the ice cliff retreats into thicker ice it will continue to expose an ever-higher cliff to the ocean and the calving rate must increase.
This process, illustrated below, is called “marine ice cliff instability” (MICI). The theory suggests that where the height of a glacier face exceeds around 100m above the ocean surface, the cliff will be too tall to support its own weight. It will, therefore, inevitably collapse, exposing a similarly tall cliff face behind it, which, too, will collapse. And so on.
The IPCC’s SROCC says that “Thwaites Glacier is particularly important because it extends into the interior of the WAIS, where the bed is >2000m below sea level in places”. (Although, the SROCC also notes that while MISI requires a retrograde bed slope to occur, MICI could even happen on a flat or seaward-inclined bed.)
This recently identified process is not as well studied as MISI, but this is sure to change in the years ahead, as scientists continue to observe fast-changing systems such as the Thwaites Glacier.
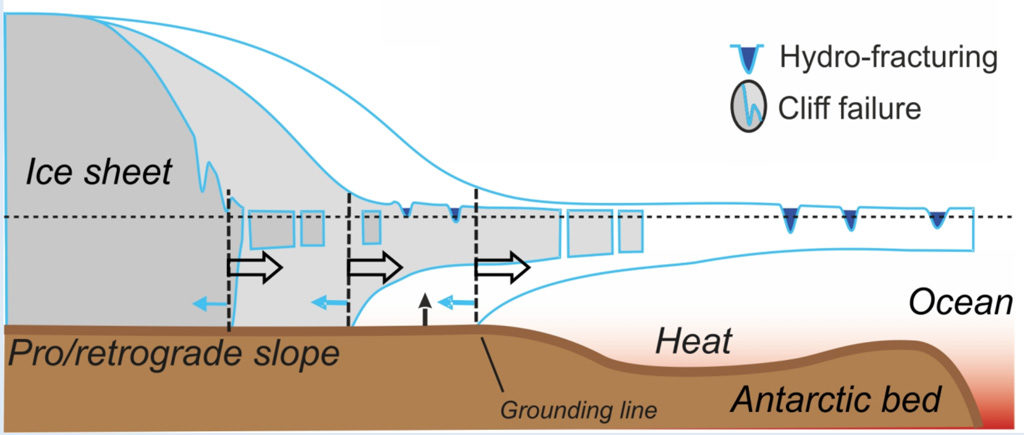
Illustration of Marine Ice Cliff Instability. If the cliff is tall enough (at least ~800m of total ice thickness, or about 100m of ice above the water line), the stresses at the cliff face exceed the strength of the ice, and the cliff fails structurally in repeated calving events. Credit: IPCC SROCC (2019) Fig CB8.1b
A Nature study in 2016 on MICI concluded that Antarctica “has the potential to contribute more than a metre of sea level rise by 2100 and more than 15 metres by 2500”. More recent research concluded this is likely to be an overestimate, but noted it is not yet clear what role MICI could play this century. Another study has also suggested that rapid loss of ice through MICI may be mitigated by a slower loss of the ice shelves that hold the glaciers back.
Threshold close
Late last year, a large team of modellers assessed different studies of ice sheet response to the Paris climate target to keep global average warming “well below” 2C.
The models all point in the same direction. Namely, that the threshold for irreversible ice loss in both the Greenland ice sheet and the WAIS is somewhere between 1.5C and 2C global average warming. And we are already at a bit more than 1C warming right now.
This 1.5-2C window is key for the “survival of Antarctic ice shelves”, the review paper explained, and thus their “buttressing” effect on the glaciers they hold back.
RCP2.6: The RCPs (Representative Concentration Pathways) are scenarios of future concentrations of greenhouse gases and other forcings. RCP2.6 (also sometimes referred to as “RCP3-PD”) is a “peak and decline” scenario where stringent mitigation and carbon dioxide removal technologies mean atmospheric CO2 concentration peaks and then falls during this century. By 2100, CO2 levels increase to around 420ppm – around 20ppm above current levels – equivalent to 475ppm once other forcings are included (in CO2e). By 2100, global temperatures are likely to rise by 1.3-1.9C above pre-industrial levels.
Another threshold may lie between 2C and 2.7C, the authors added. Reaching this level of global temperature rise could trigger the “activation of several larger systems, such as the Ross and Ronne-Filchner drainage basins, and onset of much larger SLR contributions”.
The Ross and Ronne-Filchner are the two largest ice shelves in Antarctica. These could be substantially reduced “within 100–300 years”, another study says, in scenarios where global emissions exceed the RCP2.6 scenario. This emissions pathway is generally considered to be consistent with limiting warming to 2C.
These findings imply that preventing substantial Antarctic ice loss relies on limiting global emissions to – or below – RCP2.6. As the paper concludes: “Crossing these thresholds implies commitment to large ice-sheet changes and SLR that may take thousands of years to be fully realised and be irreversible on longer timescales.”
The post Guest post: How close is the West Antarctic ice sheet to a ‘tipping point’? appeared first on Carbon Brief.


