


This one’s for the energy nerds out there. The University of Texas Austin’s Energy Institute has put out an incredibly useful interactive map showing what types of power plants are cheapest to build in every county in the continental United States. (No, really, it’s fascinating.)
Playing around with the map, you can see why natural gas and renewables are likely to provide much of America’s new electric capacity going forward. It also shows why, despite Trump’s promises, it will be extremely difficult to build new US coal plants anytime soon. And you can explore the effects a carbon tax might have on America’s grid — or, say, the development of much cheaper nuclear reactors.
Let’s start with the basics. This map below shows the cheapest power plant to build today in every county, when “availability zones” are factored in (based on where the researchers expect you could physically build a plant). In most of the US, the lowest-cost plants tend to be natural gas combined cycle plants (NGCC, in red) or wind farms (in green). In the West, utility-scale solar photovoltaic plants (in purple) prevail:
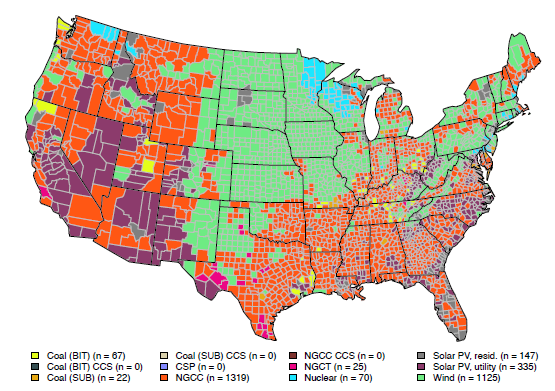
This explains why solar, wind, and natural gas have been the vast, vast majority of new capacity additions in the past few years — and will be for the foreseeable future, according to the US Energy Information Administration.
In an accompanying paper, the University of Texas team behind the project explains that they calculated the levelized cost of electricity for power plants in each county — taking into account construction costs, financing, operating costs, capacity factors, fuel, transmission, and more. “We wanted to get as much as we could in there,” explains Joshua Rhodes, a postdoctoral research fellow at the University of Texas who was involved in the project.
If you want, you can also compare two different power plants side by side in any given US county with this calculator. It also lets you factor in the health and pollution damage from different types of power plants.
A few caveats: The map and calculator do not (yet) include the cost of backing up intermittent sources like wind and solar. They also don’t incorporate effects of state regulations in places like California, and they do not include the effect of federal tax credits for wind and solar — the latter currently reduce the cost of renewables by about 30 percent. If you knock down the price of wind and solar accordingly in the interactive map, both become the cheapest option in a few more areas. (The team is working on building in some of those factors as the calculator evolves.)
Even so, it’s fun to play around with. Here are a few things I noticed:
1) New coal plants are too costly to build virtually everywhere — and that’s hard to change
The first thing to note is that almost nowhere in the country is it cheapest to build a new coal plant. Even without subsidies, wind remains the cheapest option in the middle of the country. And coal can’t compete with natural gas, particularly since the fracking boom has made shale gas so cheap.
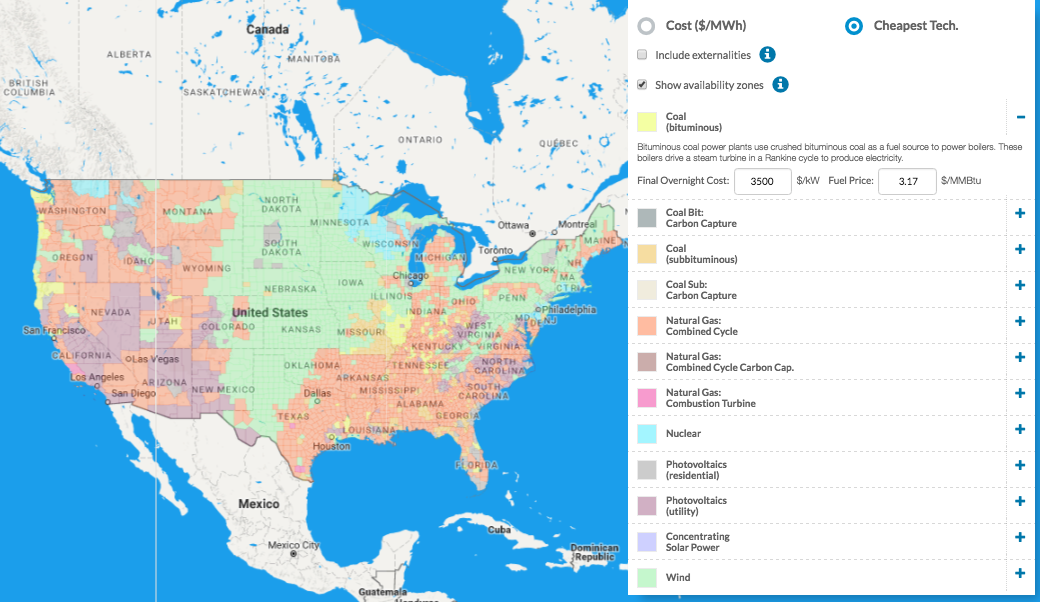
Indeed, fiddling with the map, it’s really tough to see any halfway plausible future for new conventional coal. For instance, I imagined a scenario in which Trump repeals President Obama’s climate rules for new coal plants, which would reduce the construction cost from $4,800 per kilowatt down to, say, $3,500/kW. Then I imagined that natural gas prices surge from $5/MMBtu up to $8/MMBtu, which would likely require a massive restriction in fracking. (Trump is obviously not considering the latter.)
Even in this incredibly favorable — and unlikely — scenario for coal, a new coal plant (in yellow or orange) is almost never the cheapest option anywhere, outside of southern Illinois and the Northwest (where state restrictions would block new coal anyway). Even then, any coal plant would struggle to compete with cheaper wind and more efficient gas plants elsewhere:
Some of that comes down to pure efficiency, says Rhodes. A natural gas combined cycle plant can convert about 60 percent of its fuel into electricity by both combusting the gas and trapping waste heat that then gets turned into electricity. Coal plants typically max out at 35 percent efficiency.
2) A carbon tax would — no surprise — heavily favor renewables
The calculator also lets you simulate a tax that basically forces all power plants to pay for the climate-change damage of the pollution they cause. As you might expect, that would really hurt coal — but it also chips away at natural gas, which produces about half as much CO2 as coal when burned for electricity.
For simplicity’s sake, let’s imagine a carbon tax worth $36 per ton of CO2, which is the Obama administration’s central estimate for the “social cost of carbon” in 2015. If you put this in, wind really dominates, though you also see nuclear power (in light blue) become the cheapest option in a few counties, particularly in the Southeast and in Wisconsin. (That doesn’t mean they’d actually get built, just that they’d be in theory the lowest-cost option for that location.)
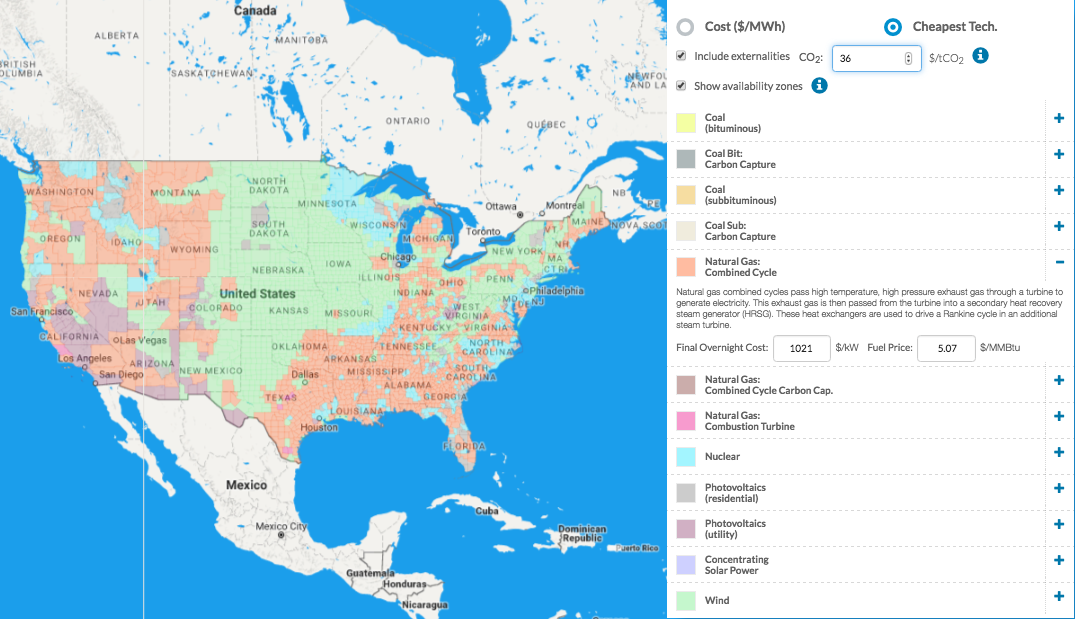
Note that you have to drive the carbon tax up pretty high (to about $200/ton) before natural gas becomes uneconomical in the vast majority of the country, at least at current prices.
3) Nuclear power could be more competitive — but it needs serious cost reductions
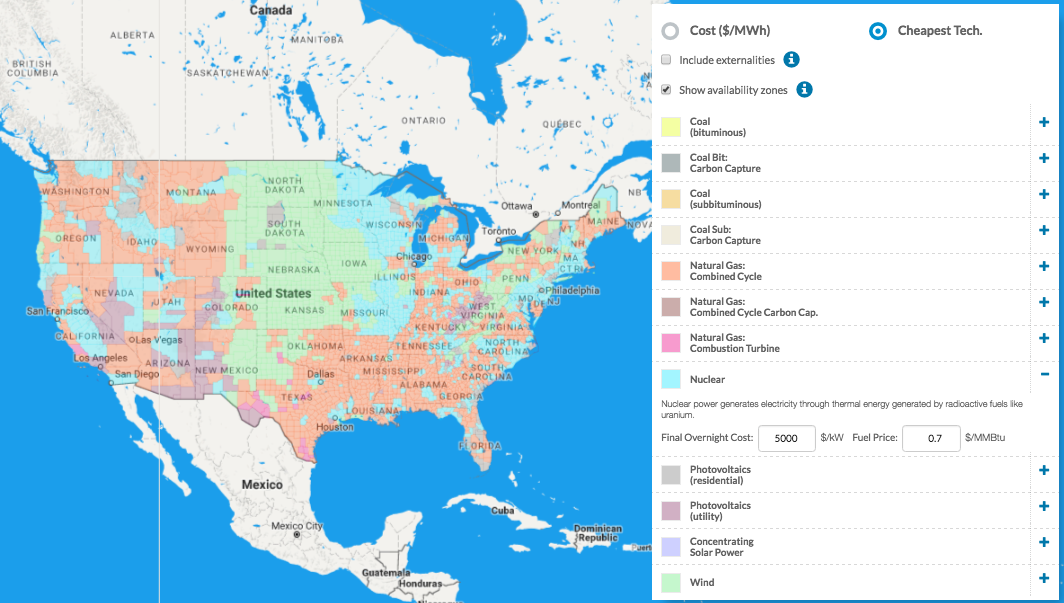
The paper estimates that it currently costs about $8,000/kW to build a new nuclear plant in the United States, and that’s before you include the extra costs of financing it.(The Energy Institute researchers used a higher estimate than the US government does — in part to account for recent cost overruns in places like Georgia.) That high price tag has scared away most utilities, particularly in deregulated markets.
But Rhodes notes that if advanced reactor technologies could push that price down to $5,000/kW or $4,000/kW, nuclear becomes a low-cost option on much of the map, like so:
Right now, there are a bunch of companies working on advanced reactor designs that, they hope, could one day prove far safer and cheaper than the bulky reactors of old. NuScale, for instance, is developing smaller modular reactors less than 300 megawatts in size that, in theory, could be mass-produced at a factory and shipped on site, reducing construction costs and allowing for more learning by doing.
The catch, however, is that these reactors are still a ways off — they have an extensive licensing and regulatory process to go through — and no one really knows what they’ll end up costing. Plus, new reactors may face local opposition. And, of course, if wind and solar continue to get cheaper, they’ll provide even fiercer competition. Still, this calculator helps give at least a rough sense of what market conditions might allow nuclear power to thrive going forward.
In any case, this calculator is still a work in progress, and there are still a lot of things it doesn’t show. It doesn’t, for instance, say anything about existing plants — so, for instance, it can’t tell you under what market conditions it would make sense to retire an existing coal or nuclear plant (many utilities are currently shuttering their existing coal and nuclear plants in the face of gas and wind). It also doesn’t yet factor in the full costs of managing the variability in wind and solar output. As mentioned above, it doesn’t take into account all state and federal subsidies. And it doesn’t look at offshore wind farms.
“Future work,” the team also notes, “can include such aspects as firming power, transmission and distribution upgrades, impacts to terrestrial and aquatic biodiversity, and a full accounting for the value of water used in thermal plants.”
Still, it’s an impressive tool for understanding power plant costs in the United States, and the first to take regional and geographic factors into account in such rich detail. Have at it!
Further reading:
- Here’s a link to the interactive map, and here’s a calculator where you can compare the cost of building new power plants in an individual count.
- Here’s the Energy Institute paper that discusses the work behind the map/calculator.
- The Energy Institute has a host of other related papers around “The Full Cost of Electricity.” You can find a table of contents here. This paper looks at the cost of transmission for new power plants. This paper looks at options for integrating photovoltaic generation into the grid.


