
Abstract
In contrast to the general stratospheric ozone recovery following international agreements, recent observations show an ongoing net ozone depletion in the tropical lower stratosphere (LS). This depletion is thought to be driven by dynamical transport accelerated by global warming, while chemical processes have been considered to be unimportant. Here we use a chemistry–climate model to demonstrate that halogenated ozone-depleting very short-lived substances (VSLS) chemistry may account for around a quarter of the observed tropical LS negative ozone trend in 1998–2018. VSLS sources include both natural and anthropogenic emissions. Future projections show the persistence of the currently unaccounted for contribution of VSLS to ozone loss throughout the twenty-first century in the tropical LS, the only region of the global stratosphere not projecting an ozone recovery by 2100. Our results show the need for mitigation strategies of anthropogenic VSLS emissions to preserve the present and future ozone layer in low latitudes.
Main
After the discovery of the Antarctic ozone hole in the 1980s1,2, numerous studies have focused on the future evolution of stratospheric ozone layer depletion given its relevance for life on Earth3. The Montreal Protocol, signed in 1987 with later amendments and adjustments, limits the production of ozone-depleting substances (ODS) from industrial activity. The ODS are long-lived compounds (that is, lifetimes larger than 5–100 years4) that are unreactive in the troposphere and reach the stratosphere unaltered, where they release chlorine and bromine species that are highly reactive with ozone3. Following these controls, the stratospheric ozone has shown the first signs of an overall recovery5,6, especially over Antarctica7 and in the upper stratosphere8.
However, ref. 9 reported that the ozone concentration in the extra-polar (60° S to 60° N) lower stratosphere (LS; that is, from the tropopause to ~30 hPa) continued with a negative long-term trend during the early twenty-first century centred in tropical latitudes, despite the decline of halogenated long-lived ODS concentrations registered since the beginning of the century7,10. Indeed, the tropical LS ozone abundance is also linked to long-term climate change induced by anthropogenic greenhouse gases (GHGs)11. Increased atmospheric GHG levels contribute to accelerate the tropical upwelling, as part of the stratospheric overturning circulation12, and thus reduce the LS ozone concentrations13. This apparent exception to the overall stratospheric ozone recovery is, in turn, highly relevant given that ozone perturbations in the LS have a particularly large impact on the ultraviolet radiation at the surface in the tropics14,15 and the radiative balance, entailing climate implications11,16.
In addition to long-lived ODS, emissions of very short-lived substances (VSLS) also contribute to the total halogen injection into the stratosphere and therefore to ozone depletion17,18,19,20. VSLS are tropospheric reactive halogenated compounds with lifetimes less than 6 months, emitted from both anthropogenic and natural sources. They include, respectively, chlorine species from industrial activity21 and bromine and iodine substances primarily emitted by oceanic biological and photochemical processes22,23. Despite their short lifetimes, VSLS can be rapidly lifted to the stratosphere by tropical deep convection24,25. Although short-lived chlorine compounds (VSL-Cl) are not considered in the Montreal Protocol, they are identified as the major ozone-depleting VSLS due to their increasing anthropogenic emissions, particularly from Asia26, leading to an estimated stratospheric chlorine injection of ~111 (±22) parts per trillion by volume (pptv) in 2017 (ref. 27). Dichloromethane (CH2Cl2) is the most abundant, with the fastest increasing emissions at present28, although emissions of chloroform (CHCl3) have also grown rapidly29. Bromine species (VSL-Br; for example, CHBr3 and CH2Br2) provide a natural source of bromine to the stratosphere (~5 pptv; ref. 20), which is highly efficient in depleting LS ozone (~60 times more than chlorine globally30). Even though iodine (VSL-I) contributes a small fraction of the total VSLS injected to the stratosphere (~0.7 pptv; refs. 19,31), it also contributes to stratospheric ozone loss19,31,32,33,34 due to the large ozone-depleting efficiency of iodine (~130 times larger than chlorine in the extra-polar stratosphere35). The influence of anthropogenic VSL-Cl27 and natural VSL-Br36 on the total stratospheric ozone column has been previously described, although a comprehensive understanding of the chemical influence of VSLS on the LS ozone evolution has not been reached yet.
Chemical transport model simulations with prescribed meteorology over 1996–2017 were used by ref. 5 to conclude that the dominant cause of the observed trend in LS ozone was dynamics. Based on specified trends in upper tropospheric anthropogenic VSL-Cl, and an assumed increase of 0.5 pptv VSL-Br per decade, they suggested that contributions from VSLS chemistry were small compared to atmospheric dynamics controlling the long-term depletion associated with tropical upwelling intensification and a strong interannual variability37. Note that their model did not consider stratospheric iodine.
In this article, we revisit the role of VSLS in the long-term tendency of tropical LS ozone using a state-of-the-art chemical scheme and emission inventories of halogens (chlorine, bromine and iodine) with the Community Earth System Model (CESM38). Oceanic VSL-I emissions and a complete tropospheric chemical scheme of natural and anthropogenic VSLS are included to assess the recent past and future evolution of tropical LS ozone. Our results show that VSLS substantially amplify by one quarter the modelled total tropical LS ozone negative trend over 1998–2018. We find that VSLS-mediated ozone depletion occurs due to reactions in concert with natural and anthropogenic VSLS together. A set of future projections based on Representative Concentration Pathways (RCP) RCP6.0 and RCP8.5 combined with different VSLS emission scenarios are also explored to estimate a range of potential impacts. These future scenarios suggest that, by controlling emissions of anthropogenic VSLS, up to 25% of the tropical LS ozone depletion by the end of the twenty-first century may be prevented.
Recent past tropical lower stratospheric ozone depletion
We first explore the role of VSLS on modelled ozone changes in the tropical LS over the recent past (Methods). A complete set of experiments is performed including all (VSLall), only natural (VSLnat), only anthropogenic (VSLant) and neglecting VSLS (nVSL) emissions into the CESM atmospheric component driven by observed forcings (for example, sea surface temperature). Each experiment includes six-member ensembles to account for the contribution of stochastic internal atmospheric variability on ozone changes.
Figure 1a shows strong variability in the simulated monthly anomalies of tropical LS (defined here between 30° S and 30° N and between 95 and 30 hPa) ozone concentration across the experiments, which is consistent with observations (that is, the Bayesian Integrated and Consolidated BASIC39 observational product). Previous works attribute such strong interannual variations to modes of internal variability associated with changes in tropical upwelling such as El Niño–Southern Oscillation40,41 and the quasi-biennial oscillation37,42,43. Across 1998–2018, these high-frequency fluctuations dominate the tropical LS ozone variability, representing 93% of the total variance. Nevertheless, observations show a negative long-term trend in tropical LS ozone over 1998–2018 (refs. 9,37), which is also present in our simulations. The large interannual variability over a relatively short period suggests that the 1998–2018 trend is largely determined by the leading modes of internal variability rather than by long-term modulators (mainly GHG-driven tropical upwelling acceleration and chemical depletion due to increasing VSLS emission). However, this does not necessarily rule out that long-term modulators may still be playing a secondary but important role.

a, Indices of deseasonalized monthly ozone anomalies relative to the 1998–2018 mean averaged over the tropical (30° S to 30° N) LS (95–30 hPa) and their linear fit using BASIC observational database (Obs.) and the ensemble-mean VSLall and nVSL simulations. Shadings indicate ±2-sigma uncertainty from observations and ±95% confidence interval of the six-member ensemble-mean in simulations. b, Vertical profile in pressure levels (hPa) of the tropical ozone linear trend in observations ±2-sigma uncertainty (grey shading) and the six-member ensemble-mean simulations ± 95% confidence interval (error bars). Horizontal lines delimit the LS vertical range. c, Bar charts of the tropical LS ozone linear trend in observations and the six-member ensemble-mean VSLall, VSLnat, VSLant and nVSL experiments ± 95% confidence interval (error bars). Shaded areas indicate the 95% probability threshold of stochastic internal variability of the atmosphere according to a non-parametric statistical test (details in Methods).
The model also reproduces, within the limits of respective uncertainties, the vertical distribution of the observed tropical ozone trend with the most marked depletion in the LS (between 95 hPa and 30 hPa) and a recovery in upper levels, roughly above 10 hPa (Fig. 1b). Both the VSLall and nVSL simulations show good agreement in the mid-stratosphere and upper stratosphere (that is, above 30 hPa), where temperature changes strongly affect ozone44, while in the LS, VSLall compares better with observations. This result reveals that in the tropics the simulated VSLS-mediated stratospheric ozone depletion is mostly restricted to the LS. Focusing on the mean tropical LS ozone relative anomalies, observational data show a trend of −1.5% per decade with large 2-sigma uncertainty of ±1.1% per decade (Fig. 1c), mostly attributable to early years of the 1998–2018 period (Fig. 1a) and lowermost-level data (Fig. 1b)39. Below the LS, the observed 100 hPa ozone trend is too uncertain (±10%, denoted with dashed line in Fig. 1b) to evaluate comparisons with simulations.
Among all simulations, only VSLall represents an ensemble-mean trend (−1.0% per decade) that is significantly within the 2-sigma interval of the observations (Fig. 1c). Although within observational uncertainty, the underestimation of the observed trend in VSLall could be attributed to model biases and/or unresolved processes involving ozone depletion. The other simulations (VSLnat, VSLant and nVSL) show weaker and similar ensemble-mean trends that barely emerge from the stochastic signal of atmospheric internal variability (grey shading in Fig. 1c). They all underestimate by about 25–38% the ozone trend characterized by VSLall. This result implies that if any of the VSLS emissions are not considered (that is, anthropogenic and natural contributions), at least a quarter of the recent tropical LS ozone depletion tendency cannot be explained.
Note that the large ensemble uncertainties (as a measure of the influence of atmospheric internal variability), along with the negative trend consistently represented by all VSLS experiments (Fig. 1c), support the role of dynamical changes suggested by ref. 5. Nonetheless, we show that the effect of dynamic changes on the recent tropical LS ozone trend is amplified by VSLS through chemical mechanisms to a substantial extent and must be considered for a better understanding of the different behaviour of stratospheric ozone recovery within different regions and heights.
VSLS-mediated ozone loss in the tropical LS
Figure 2 shows modelled ozone loss reaction rates grouped by chemical families and normalized by ozone concentrations. Natural VSLS emissions alone enhance by 6.2% the net ozone loss rate (mean rate in VSLnat relative to the nVSL experiment), while anthropogenic VSLS account for a small 0.5% net increment (VSLant relative to nVSL) (Fig. 2a). Jointly, all VSLS emissions enhance the total budget of ozone loss reactions (VSLall relative to nVSL) by 6.7%, suggesting an additive contribution of different VSLS sources, natural and anthropogenic. The decomposition into families, that is, ozone-depleting cycles grouped by the mediating species (Supplementary Table 1), shows that the net ozone loss rate is dominated by hydrogen-catalysed chemistry (HOxloss). However, the overall impact on ozone loss when including VSLS and its chemistry (percentages in Fig. 2a) is mainly accounted for by halogen-mediated reactions. In particular, iodine is found to be notably efficient at destroying tropical LS ozone compared with the other halogens (Methods).
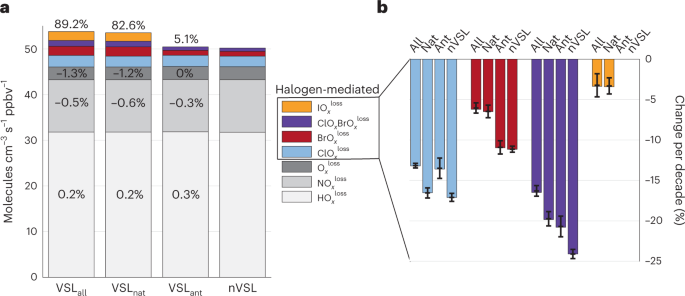
a, The 1998–2018 mean rates decomposed into families in units of molecules per cubic centimetre per second per parts per billion by volume (ppbv) of ozone. Percentages indicate the increase of the HOxloss, NOxloss, Oxloss and (on top) the sum of all halogen-mediated reaction rates relative to the nVSL experiment. b, Bar charts of the relative linear trend over 1998–2018 of halogen-mediated families presented as the six-member ensemble-mean ± the 95% confidence interval (error bars).
The 1998–2018 linear trends of the individual halogen-mediated ozone loss reaction rates are characterized by an underlying negative trend (due to the ongoing control of long-lived halogens emission) (Fig. 2b). The comparison across experiments reveals different trends in the reaction rates that are coherent with the corresponding ozone changes and highlights the dependence on the different VSLS considered. When VSLS are included, the overall negative trend of the ozone loss rates from reactions catalysed by halogens is buffered in the corresponding halogen families (that is, the absolute negative trend is less pronounced), compared with nVSL (Fig. 2b). Separately, emissions of natural (mostly bromine and iodine species) or anthropogenic (mostly chlorine compounds) VSLS induce substantial buffering in the ClOxloss or BrOxloss trends, respectively, while both modulate the ClOx–BrOxloss crossed reactions to a similar extent (Fig. 2b). In contrast, the combined effect of both natural and anthropogenic sources leads to substantial trend changes in all chlorine- and bromine-mediated reaction rates, particularly in the ClOx–BrOxloss crossed reactions, which presents the largest percentage trend change. In comparison with these families, iodine-mediated reactions show weak trend values, consistent with a nearly constant iodine injection into the tropical LS (Extended Data Fig. 1), and no significant differences across VSLall and VSLnat experiments. Therefore, even though the amplification of the net ozone loss in tropical LS cannot be linearly attributed to the relative trends of individual families, as noted before, this result supports the relevant role of crossed catalytic reactions between halogens (particularly bromine and chlorine) from natural and anthropogenic VSLS sources. That is, the effectiveness of VSLS modulation of the dynamical 1998–2018 long-term change in tropical LS ozone concentration relies on the reactions in concert with natural and anthropogenic compounds together.
Human influence on the LS ozone fate
According to the results shown above, VSLS may well play an important role in the long-term fate of the tropical LS ozone as a consequence of the combined effect of natural and anthropogenic compounds. Note also that GHG-driven tropical upwelling acceleration is another important long-term modulating factor12 identified as the dominant driver of the future tropical LS ozone depletion in chemistry–climate model (CCM) simulations45. Considering this, we now investigate whether the projected GHG-driven reduction of tropical LS ozone by the end of the twenty-first century can be to some extent buffered by controlling anthropogenic chlorinated VSLS emissions.
A set of four future simulations, spanning to the year 2100, were performed with the CESM fully coupled configuration using two RCP emission scenarios, namely RCP6.0 and RCP8.5 (ref. 46). For both emission scenarios, we explore a range of future anthropogenic chlorine VSLS emissions determined by lower- and upper-limit approaches (Methods). These lower- and upper-limit scenarios, respectively, represent a progressive mitigation starting in 2031 to zero emissions in 2100 and an uncontrolled business-as-usual emissions growth along the twenty-first century (Extended Data Fig. 2). In turn, future natural bromine and iodine VSLS emissions are coupled and vary in response to climate change47.
Under the RCP8.5 with the upper-limit chlorine VSLS scenario (UppLim8.5; that is, assuming business-as-usual increasing emissions of anthropogenic GHG and VSLS in the future), tropical LS ozone is projected to decrease by 5.1% (20 year mean; 2080–2099) compared with the 1998–2018 (recent past) mean (Fig. 3). Following the RCP8.5 with the lower-limit chlorine VSLS scenario (LowLim8.5; that is, assuming business-as-usual GHG but including reductions in VSLS anthropogenic emissions; Extended Data Fig. 2), the model represents similar tropical LS ozone long-term evolution up to the 2060s, when it diverges toward a smaller 4.2% ozone loss by 2100. Similarly, the projections under the RCP6.0 in combination with the upper-limit (UppLim6.0) and the lower-limit (LowLim6.0) chlorine VSLS emission scenarios also reveal decreasing tropical LS ozone concentrations compared with the recent past, although to a smaller extent (2.9% and 2.0% by 2100, respectively). In all cases, simulated ozone concentrations by 2100 are below the threshold of severe depletion values relative to the recent past, defined as the lower limit of the 20 year mean ozone changes in 1998–2018 (horizontal dashed line in Fig. 3; Methods).
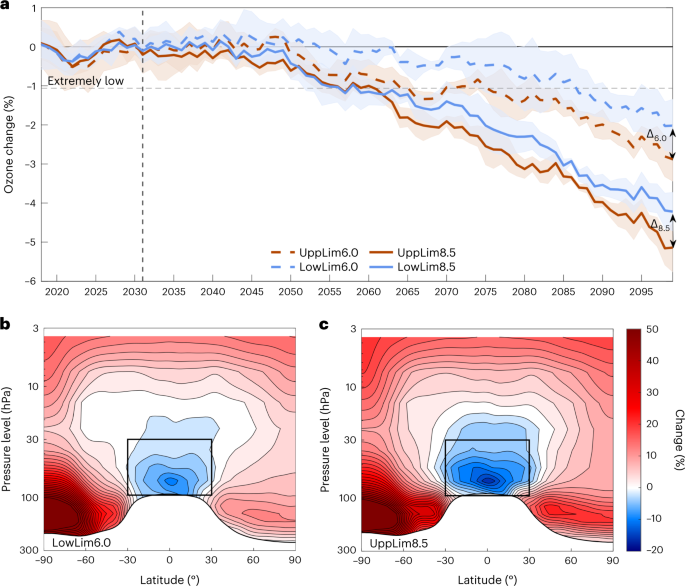
a, Indices of the change of 20 year mean ozone concentration relative to the 1998–2018 average in UppLim8.5, LowLim8.5, UppLim6.0 and LowLim6.0 simulations. Indices represent four-member ensemble-mean values ± 95% confidence interval. The horizontal dashed line marks the threshold of severe ozone depletion relative to the recent past (Methods). ∆6.0 and ∆8.5 for the gap obtained by 2100 by reducing anthropogenic VSLS emissions, respectively, under RCP6.0 and RCP8.5 scenarios. b,c, Latitude–height profiles in pressure levels (hPa) of the four-member ensemble-mean stratospheric ozone change averaged across 2080–2099 represented, respectively, by LowLim6.0 (b) and UppLim8.5 (c) simulations.
Therefore, tropical LS ozone is projected to undergo very low levels by the end of the twenty-first century without precedent in the recent past. The lowest ozone concentrations are reached by 2100, regardless of the anthropogenic VSLS emissions scenario, highlighting the dominant role of GHG-driven effects on atmospheric dynamics. However, our results show a substantial and important role of VSLS modulating tropical LS ozone abundances at the end of the century. We find a substantial difference between the upper-limit and the lower-limit chlorine VSLS scenarios (denoted with ∆8.5 and ∆6.0 in Fig. 3a), representing between 18% and 30% larger ozone decrease by 2100 under RCP8.5 and RCP6.0 conditions, respectively. This result suggests that, if the ongoing rate of increase of anthropogenic VSLS emissions continues, VSLS-driven ozone destruction will reinforce the negative GHG-driven effects on the tropical LS by up to one quarter at the end of the twenty-first century.
By defining a point of no return from which the simulated tropical LS ozone significantly exceeds the threshold of very low values, we can estimate that a larger delay of significant ozone depletion in the future associated with the mitigation of chlorinated VSLS emissions can be achieved under the RCP6.0 scenario than in the RCP8.5 conditions (Fig. 3a). In addition, anthropogenic emissions are projected to have a greater contribution to the absolute VSLS-induced ozone loss by 2100, compared with natural VSLS, especially under RCP8.5 conditions (Supplementary Table 2). This reinforces that reducing anthropogenic chlorine VSLS emissions to preserve the tropical LS ozone will be more efficient in the future, and particularly if GHG effect is simultaneously mitigated, not only in preventing ozone loss by 2100 (12% more efficient under RCP6.0 than RCP8.5 conditions) but also in delaying a stage of severely low ozone levels, relative to the recent past.
Particularly striking is the ozone evolution in the tropical LS relative to the whole stratosphere during this century. Our projections show that the tropical LS is the only region in the global stratosphere where ozone levels do not show a recovery to the pre-ODS period (~1950) or present day regardless of the scenario considered (Fig. 3b,c and Extended Data Fig. 3), which is consistent with other modelling studies45,48,49. Such a peculiarity calls for further research on the dynamical and chemical drivers of the evolution of tropical LS ozone in this climatically relevant region of the atmosphere, which could affect the LS ozone recovery at high latitudes (Extended Data Fig. 4).
Discussion
VSLS are found to substantially amplify the modelled tropical LS ozone depletion through chemistry–dynamics couplings. In contrast, the previous work of ref. 5 did not identify a significant role of chlorine and bromine VSLS in the recent-past trend of extra-polar LS ozone, including the tropical region, compared with the dominant control of atmospheric dynamics. Two main differences with this work, respectively concerning chemical and dynamical processes, can explain such a discrepancy. First, we consider a full chemical scheme of halogens both in the troposphere and in the stratosphere in combination with the most complete inventory of natural and anthropogenic VSLS emissions to date. This includes emissions of iodine species—not considered by ref. 5, but which are found to be highly efficient in depleting tropical LS ozone and, hence, relevant to characterize its evolution—and the tropospheric chemical pre-processing of natural VSLS into reactive species from their emission at the surface to their injection in the LS, instead of prescribed mixing ratios of organic compounds at the tropopause. Second, the ensemble approach used in our CCM simulations allows constraining the large component of the internal atmospheric variability in tropical LS ozone changes and thereby the identification of the VSLS effect comparing different sensitivity experiments.
Regarding the future long-term evolution of the tropical LS ozone, all scenarios considered in this work represent a continuous depletion by the end of the twenty-first century that offsets the overall stratospheric ozone recovery. This is consistent with an increase in tropical upwelling (Extended Data Fig. 5) in agreement with other CCMs with prescribed long-lived chlorine and bromine and GHGs45,48,49,50. These works conclude that the strengthened upwelling associated with global warming due to GHGs is the main cause of future depleting tropical LS ozone rather than changing long-lived halogens. However, our results show that combined natural and anthropogenic halogens, in the form of VSL compounds, may also have a substantial effect on the future tropical LS ozone amounts.
In summary, we find that VSLS, currently not considered in climate models, play an important role in the observed recent tropical LS ozone trend. The results indicate that it is essential to consider a complete inventory of halogen emissions and chemical processing that includes all VSLS (natural VSL-Br and VSL-I and anthropogenic VSL-Cl, in particular, reacting in concert) both in the troposphere and in the stratosphere to accurately characterize ozone trends in the tropical LS. In consequence, based on currently available VSLS inventories, we can estimate that, if no steps are taken to restrict the emissions of VSLS species from industrial activity, the tropical LS ozone depletion expected by the end of the twenty-first century due to GHG effects may be amplified by up to one quarter due to VSLS. This result is a step forward in modelling key chemistry–climate couplings controlling the tropical LS ozone long-term changes to consider in future work with other CCMs. This is important not only for understanding the recent observed ozone trends in the tropical LS but also to assess its future evolution, suggesting the need of considering restrictions on anthropogenic VSLS species in upcoming Montreal Protocol amendments.
Methods
Experimental set-up
In this work, the CESM (version 1.1.1) is used, which includes the Community Atmospheric Model with interactive chemistry (CAM-Chem, version 4), with a spatial resolution of 1.9° in latitude, 2.5° in longitude and 26 vertical levels from surface to 3.5 hPa (refs. 51,52). The ‘standard’ chemical scheme includes 169 species with comprehensive photochemistry (gas-phase and heterogeneous reactions) and is coupled to the radiation scheme38. The latter is complemented with a state-of-the-art chemical processing of VSLS (containing chlorine, bromine and iodine) in the troposphere and the stratosphere, including heterogeneous recycling reactions, and dry and wet deposition of natural halogens19,53,54,55, broadly validated by previous work (Supplementary Section 1). Changes in the baseline emission inventory of natural sources of biogenic halogens (CHBr3, CH2Br2, CH2BrCl, CHBr2Cl, CHBrCl2, CH3I, CH2I2, CH2IBr and CH2ICl)56, centred around year 2000, follow observational estimate trends (~2% increase between 1998 and 2018)57,58. Even with this slight increase, the relative contribution of VSLS to total stratospheric bromine has increased up to 25% due to the decline in the abundance of regulated long-lived bromine10. The anthropogenic emissions inventory includes chlorinated species (CH2Cl2, CHCl3, C2Cl4, C2HCl3 and C2H4Cl2)27 that follow an ~8% increment in the recent past (Supplementary Table 3). Note that other anthropogenic VSL-Br were not included59 as they have comparatively minor and more uncertain contribution to the tropospheric halogen budget than that arising from anthropogenic VSL-Cl28,60. Finally, oceanic iodine emissions also include an abiotic route (HOI and I2), implemented as a parameterization of ozone deposition to the ocean and reactions with seawater iodide61. Further evaluation of the VSLS sources used is included in Supplementary Section 1.
A first set of recent-past experiments over 1960–2018 were performed to detect changes in tropical LS ozone concentration over 1998–2018 driven by VSLS and to attribute them to natural or anthropogenic species. Following the Chemistry–Climate Model Initiative (CCMI) REF-C1 reference set-up38, free-running simulations with the CESM atmospheric component were used to this aim including observed monthly data from the Hadley Centre sea ice and sea surface temperature dataset62 as boundary conditions. Then, four experiments were performed considering different combinations of emissions from natural and anthropogenic sources, that is, including all (VSLall), only natural (VSLnat), only anthropogenic (VSLant) and no VSLS (nVSL). Six-member ensembles were run for each experiment using different initial states following ref. 38, that is, taking initial conditions from a generic CESM simulation of the twentieth century to initialize each member in a different consecutive year from 1950 as spin-up and keeping the simulations since 1960. The ensemble size was tested to be significantly representative of the uncertainty in the 1998–2018 trend of the simulated tropical LS ozone arising from the stochastic internal variability of the atmosphere (Supplementary Section 3).
We used ensembles to account for the noisy effect of internal atmospheric variability on tropical LS ozone and reduce it by analysing ensemble-mean values. We therefore ruled out the use of specified dynamics simulations (CCMI REFC1SD set-up38), which are typically used to isolate the contribution of atmospheric dynamics (that is, by fixing all experiments to a common meteorology) and have also been reported to result in inconsistencies in the simulated tropical upwelling63,64,65,66.
A second set of simulations was performed to evaluate the evolution of tropical LS ozone in the future (1960–2099) under different scenarios of GHG and anthropogenic VSLS emissions. In this case, the fully coupled configuration of the CESM, following the CCMI REF-C2 reference set-up38, was used including monthly varying boundary conditions for atmospheric concentrations of GHGs, following the intermediate RCP6.0 and the business-as-usual RCP8.5 scenarios46,67 in the future (2006–2099), along with long-lived compounds containing halogens according to the A1 scenario of rapid economic development (WMO, 2011). These pathways were combined with a lower-limit and an upper-limit scenario of anthropogenic VSLS emissions to represent a range of different eventual changes in the emissions trend by 2100 (described in the paragraph below). To constrain the influence of internal variability from the response to GHGs forcing and VSLS, four-member ensembles of each simulation are run to analyse the long-term evolution of the ensemble-mean tropical LS ozone concentration. A smaller ensemble size than in the previous exercise was used as long-term changes of tropical LS ozone were analysed in these future projections (that is, low-pass-filtered indices with a 20 year moving mean, which largely removes the signal of internal variability from decadal to lower timescales).
In both sets of simulations, anthropogenic VSLS mixing ratios are fixed at the surface as lower boundary conditions following the inventory of ref. 27 in the recent past (2000–2017). In addition, our future simulations include anthropogenic VSLS trends extended into the future to year 2031. Then, the range of different scenarios of anthropogenic VSLS emissions is represented by a lower limit, which considers a linear reduction to zero emissions in 2100, and an upper limit with extended trend until 2100 (Extended Data Fig. 2). Natural emissions are based on the ref. 56 inventory around year 2000 and scaled using observationally derived trends in ref. 58 to represent a 3.7% increase in the recent past (from 1998 to 2018) and a 15.0% increase by the late twenty-first century (2080–2099 mean) relative to the recent past (Supplementary Fig. 3a). However, other estimates of future natural VSLS emissions have been also proposed based on their link to climate change36,47,57. To account for these uncertainties, we used the extended observed trend by ref. 58 in the upper-limit VSLS emission scenarios; in the lower-limit emission case, the lowermost approach proposed by previous works, which is derived from the sea surface temperature and biogeochemical response to climate change47, was used representing a 9.7% and 4.1% increase in the late twenty-first century in the RCP8.5 and RCP6.0 scenarios, respectively (Supplementary Fig. 3a). In the absence of anthropogenic VSLS sources, the different natural emissions considered induce no significant changes in the tropical LS ozone levels by 2100 (Supplementary Fig. 3b). This supports the suitability of this experimental set-up to assess the tropical LS ozone fate mainly associated with changes in the future anthropogenic VSLS emissions. Two more subsets of nVSL-like future projections (that is, with no VSLS included) were also run under the RCP6.0 and RCP8.5 scenarios (used to perform Supplementary Table 2).
Ozone loss reaction rates
In this work, the ozone loss reaction rates normalized by ozone concentrations from the different recent-past VSLS experiments are analysed. These ozone loss rates are grouped by families of reactions (Supplementary Table 1), which allows decomposing the net ozone loss rate and assessing the main chemical reactions involved in the VSLS effect on tropical LS ozone. First, the ozone loss rate averaged in 1998–2018 is evaluated (Fig. 2a), showing an increment in the net ozone loss rate when VSLS are included that is mostly accounted for by halogen-mediated reactions.
Although to a much lesser extent than halogen-mediated reactions, the other families (HOxloss, NOxloss and Oxloss) were also found to differ across experiments (Fig. 2a), indicating a partial counteraction across all families in response to VSLS such that the net ozone loss rate cannot be linearly attributed to the trends in the reaction rates. Therefore, secondly, the linear trend in halogen-mediated reactions was assessed individually to estimate which ozone loss mechanisms dominate the 1998–2018 tropical LS ozone loss when all VSLS are included (Fig. 2b). This analysis focused on halogen-mediated reactions due to their prominent shift in contrast to the small trends of the main depleting families (HOxloss, NOxloss and Oxloss; Supplementary Fig. 4).
Statistics (ensemble-mean relative trend and uncertainties)
A monthly index of tropical LS ozone relative anomalies (in %) was computed as the average across the area-weighted 30° S to 30° N zonal band and the 95–30 hPa vertical levels and deseasonalized relative to the 1998–2018 climatology. Relative anomalies were assessed because the absolute value of the mean-state ozone concentration in the REF-C1 experiments depends on the content of depleting VSLS considered. Then, the tropical LS ozone trend was approached as the linear fit by least squares of the index over 1998–2018. In contrast to the multiple linear regression or dynamical linear modelling methods, broadly used to assess the long-term tendency of ozone removing the main sources of interannual variability9,39, we used the simple linear fit. To accurately isolate the VSLS-induced component of the 1998–2018 trend, we relied on a detection-and-attribution modelling approach using the VSLS experiments described above.
To evaluate the uncertainty of the observed ozone anomalies and its trend, the 95% confidence interval was represented considering the ±2-sigma uncertainty provided by the BASIC database68, which accounts for the inherent uncertainty in the data product39. In case of simulations, the 95% confidence interval of the ensemble-mean anomalies and trend was assessed, calculated from the standard deviation of the individual ensemble members and a t-test statistic, as a measure of the uncertainty induced by the internal atmospheric variability. To assess the statistical significance of the 1998–2018 trend of tropical LS ozone, the 95% probability threshold of the internal atmospheric noise was represented (grey shading in Fig. 1c), according to a non-parametric test. To do that, a probability density function of 10,000 trend values was performed for observations and all independent simulations (using individual members) from the bootstrapped monthly indices of the corresponding tropical LS ozone anomalies in 1998–2018.
In the case of the future simulations until the end of 2099, annual indices of delayed 20 year moving-mean (that is, each annual value representing the average across the previous years) tropical LS ozone anomalies (relative to the 1998–2018 mean) are analysed to assess the evolution of the long-term mean state of the ozone content. The resulting ensemble-mean index represents the long-term ozone content evolution highlighting the influence of external forcings common to all members, and the 95% confidence interval of the discrepancy across single members is an estimate of the role of the coupled climate system internal variability (Fig. 2). To set a benchmark value for very low tropical LS ozone concentrations reached over the twenty-first century relative to the recent past, a threshold of severe ozone depletion is defined as the lower limit of the 20 year moving-mean indices of tropical LS ozone anomalies in 1998–2018 of all simulations with a 95% confidence interval.
Data availability
The BASIC observational ozone dataset was downloaded from https://data.mendeley.com/datasets/2mgx2xzzpk/. Data related to this article are available in Mendeley (https://doi.org/10.17632/bmjnwmdd2s.1)69.
Code availability
The CESM software used in this work is publicly available for download at https://www.cesm.ucar.edu/models/.
References
-
Farman, J. C., Gardiner, B. G. & Shanklin, J. D. Large losses of total ozone in Antarctica reveal seasonal ClOx/NOx interaction. Nature 315, 207–210 (1985).
-
Solomon, S., Garcia, R. R., Rowland, F. S. & Wuebbles, D. J. On the depletion of Antarctic ozone. Nature 321, 755–758 (1986).
-
Solomon, S. Stratospheric ozone depletion: a review of concepts and history. Rev. Geophys. 37, 275–316 (1999).
-
Scientific Assessment of Ozone Depletion: 2018, Global Ozone Research and Monitoring Project. Report No. 58, 588 (World Meteorological Organization, 2018).
-
Chipperfield, M. P. et al. On the cause of recent variations in lower stratospheric ozone. Geophys. Res. Lett. 45, 5718–5726 (2018).
-
Petropavlovskikh, I. et al. SPARC/IO3C/GAW Report on Long-term Ozone Trends and Uncertainties in the Stratosphere. Report No. 9, WCRP-17/2018, GAW Report No. 241 (SPARC/IO3C/GAW, 2019); https://doi.org/10.17874/f899e57a20b
-
Solomon, S. et al. Emergence of healing in the Antarctic ozone layer. Science 353, 269–274 (2016).
-
Godin-Beekmann, S. et al. Updated trends of the stratospheric ozone vertical distribution in the 60° S–60° N latitude range based on the LOTUS regression model. Atmos. Chem. Phys. 22, 11657–11673 (2022).
-
Ball, W. T. et al. Evidence for a continuous decline in lower stratospheric ozone offsetting ozone layer recovery. Atmos. Chem. Phys. 18, 1379–1394 (2018).
-
Engel, A. et al. Update on Ozone-Depleting Substances (ODSs) and Other Gases of Interest to the Montreal Protocol, Chapter 1 in Scientific Assessment of Ozone Depletion: 2018, Global Ozone Research and Monitoring Project. Report No. 58 (World Meteorological Organization, 2018).
-
Iglesias-Suarez, F. et al. Key drivers of ozone change and its radiative forcing over the 21st century. Atmos. Chem. Phys. 18, 6121–6139 (2018).
-
Butchart, N. The Brewer–Dobson circulation. Rev. Geophys. 52, 157–184 (2014).
-
Karpechko, A. Y. et al. Stratospheric Ozone Changes and Climate. Scientific Assessment of Ozone Depletion: 2018 (World Meteorological Organization, 2019).
-
Newman, P. A. & McKenzie, R. UV impacts avoided by the Montreal Protocol. Photochem. Photobiol. Sci. 10, 1152–1160 (2011).
-
Bais, A. F. et al. Ozone–climate interactions and effects on solar ultraviolet radiation. Photochem. Photobiol. Sci. 18, 602–640 (2019).
-
Riese, M. et al. Impact of uncertainties in atmospheric mixing on simulated UTLS composition and related radiative effects. J. Geophys. Res. Atmos. 117, 1–10 (2012).
-
Salawitch, R. J. et al. Sensitivity of ozone to bromine in the lower stratosphere. Geophys. Res. Lett. 32, 1–5 (2005).
-
Hossaini, R. et al. Efficiency of short-lived halogens at influencing climate through depletion of stratospheric ozone. Nat. Geosci. 8, 186–190 (2015).
-
Saiz-Lopez, A. et al. Injection of iodine to the stratosphere. Geophys. Res. Lett. 42, 6852–6859 (2015).
-
Fernandez, R. P., Kinnison, D. E., Lamarque, J. F., Tilmes, S. & Saiz-Lopez, A. Impact of biogenic very short-lived bromine on the Antarctic ozone hole during the 21st century. Atmos. Chem. Phys. 17, 1673–1688 (2017).
-
Hossaini, R. et al. Growth in stratospheric chlorine from short-lived chemicals not controlled by the Montreal Protocol. Geophys. Res. Lett. 42, 4573–4580 (2015).
-
Carpenter, L. J. & Liss, P. S. On temperate sources of bromoform and other reactive organic bromine gases. J. Geophys. Res. Atmos. 105, 20539–20547 (2000).
-
Salawitch, R. J. Biogenic bromine. Nature 439, 275–277 (2006).
-
Aschmann, J., Sinnhuber, B.-M., Chipperfield, M. P. & Hossaini, R. Impact of deep convection and dehydration on bromine loading in the upper troposphere and lower stratosphere. Atmos. Chem. Phys. 11, 2671–2687 (2011).
-
Fernandez, R. P. et al. Intercomparison between surrogate, explicit, and full treatments of VSL bromine chemistry within the CAM-Chem Chemistry–Climate Model. Geophys. Res. Lett. 48, 1–10 (2021).
-
Claxton, T. et al. A synthesis inversion to constrain global emissions of two very short lived chlorocarbons: dichloromethane, and perchloroethylene. J. Geophys. Res. Atmos. 125, e2019JD031818 (2020).
-
Hossaini, R. et al. Recent trends in stratospheric chlorine from very short-lived substances. J. Geophys. Res. Atmos. 124, 2318–2335 (2019).
-
An, M. et al. Rapid increase in dichloromethane emissions from China inferred through atmospheric observations. Nat. Commun. 12, 7279 (2021).
-
Fang, X. et al. Rapid increase in ozone-depleting chloroform emissions from China. Nat. Geosci. 12, 89–93 (2019).
-
Daniel, J. S., Solomon, S., Portmann, R. W. & Garcia, R. R. Stratospheric ozone destruction: the importance of bromine relative to chlorine. J. Geophys. Res. Atmos. 104, 23871–23880 (1999).
-
Koenig, T. K. et al. Quantitative detection of iodine in the stratosphere. Proc. Natl Acad. Sci. USA 117, 1860–1866 (2020).
-
Solomon, S., Garcia, R. R. & Ravishankara, A. R. On the role of iodine in ozone depletion. J. Geophys. Res. 99, 491–499 (1994).
-
Karagodin-Doyennel, A. et al. Iodine chemistry in the chemistry–climate model SOCOL-AERv2-I. Geosci. Model Dev. 14, 6623–6645 (2021).
-
Cuevas, C. A. et al. The influence of iodine on the Antarctic stratospheric ozone hole. Proc. Natl Acad. Sci. USA 119, 1–10 (2022).
-
Klobas, J. E., Hansen, J., Weisenstein, D. K., Kennedy, R. P. & Wilmouth, D. M. Sensitivity of iodine-mediated stratospheric ozone loss chemistry to future chemistry–climate scenarios. Front. Earth Sci. 9, 1–12 (2021).
-
Falk, S. et al. Brominated VSLS and their influence on ozone under a changing climate. Atmos. Chem. Phys. 17, 11313–11329 (2017).
-
Ball, W. T. et al. Stratospheric ozone trends for 1985–2018: sensitivity to recent large variability. Atmos. Chem. Phys. 19, 12731–12748 (2019).
-
Tilmes, S. et al. Representation of the Community Earth System Model (CESM1) CAM4-chem within the Chemistry–Climate Model Initiative (CCMI). Geosci. Model Dev. 9, 1853–1890 (2016).
-
Ball, W. T. et al. Reconciling differences in stratospheric ozone composites. Atmos. Chem. Phys. 17, 12269–12302 (2017).
-
McPhaden, M. J., Zebiak, S. E. & Glantz, M. H. ENSO as an integrating concept in earth science. Science 314, 1740–1745 (2006).
-
Calvo, N., Garcia, R. R., Randel, W. J. & Marsh, D. R. Dynamical mechanism for the increase in tropical upwelling in the lowermost tropical stratosphere during warm ENSO events. J. Atmos. Sci. 67, 2331–2340 (2010).
-
Baldwin, M. P. et al. The quasi-biennial oscillation. Rev. Geophys. 39, 179–229 (2001).
-
Diallo, M. et al. Response of stratospheric water vapor and ozone to the unusual timing of El Niño and the QBO disruption in 2015–2016. Atmos. Chem. Phys. 18, 13055–13073 (2018).
-
Jonsson, A. I., de Grandpre, J., Fomichev, V. I., McConnell, J. C. & Beagley, S. R. Doubled CO2-induced cooling in the middle atmosphere: photochemical analysis of the ozone radiative feedback. J. Geophys. Res. Atmos. 109, D24103 (2004).
-
Dietmüller, S., Garny, H., Eichinger, R. & Ball, W. Analysis of recent lower-stratospheric ozone trends in chemistry climate models. Atmos. Chem. Phys. 21, 6811–6837 (2021).
-
van Vuuren, D. P. et al. The representative concentration pathways: an overview. Clim. Change 109, 5–31 (2011).
-
Iglesias-Suarez, F. et al. Natural halogens buffer tropospheric ozone in a changing climate. Nat. Clim. Change 10, 147–154 (2020).
-
Iglesias-Suarez, F., Young, P. J. & Wild, O. Stratospheric ozone change and related climate impacts over 1850–2100 as modelled by the ACCMIP ensemble. Atmos. Chem. Phys. 16, 343–363 (2016).
-
Eyring, V. et al. Sensitivity of 21st century stratospheric ozone to greenhouse gas scenarios. Geophys. Res. Lett. 37, L16807 (2010).
-
Ball, W. T., Chiodo, G., Abalos, M., Alsing, J. & Stenke, A. Inconsistencies between chemistry–climate models and observed lower stratospheric ozone trends since 1998. Atmos. Chem. Phys. 20, 9737–9752 (2020).
-
Lamarque, J. F. et al. CAM-chem: description and evaluation of interactive atmospheric chemistry in the Community Earth System Model. Geosci. Model Dev. 5, 369–411 (2012).
-
Neale, R. B. et al. The mean climate of the Community Atmosphere Model (CAM4) in forced SST and fully coupled experiments. J. Clim. 26, 5150–5168 (2013).
-
Saiz-Lopez, A. et al. Estimating the climate significance of halogen-driven ozone loss in the tropical marine troposphere. Atmos. Chem. Phys. 12, 3939–3949 (2012).
-
Saiz-Lopez, A. et al. Iodine chemistry in the troposphere and its effect on ozone. Atmos. Chem. Phys. 14, 13119–13143 (2014).
-
Fernandez, R. P., Salawitch, R. J., Kinnison, D. E., Lamarque, J. F. & Saiz-Lopez, A. Bromine partitioning in the tropical tropopause layer: implications for stratospheric injection. Atmos. Chem. Phys. 14, 13391–13410 (2014).
-
Ordóñez, C. et al. Bromine and iodine chemistry in a global chemistry–climate model: description and evaluation of very short-lived oceanic sources. Atmos. Chem. Phys. 12, 1423–1447 (2012).
-
Ziska, F., Quack, B., Tegtmeier, S., Stemmler, I. & Krüger, K. Future emissions of marine halogenated very-short lived substances under climate change. J. Atmos. Chem. 74, 245–260 (2017).
-
Ziska, F. et al. Global sea-to-air flux climatology for bromoform, dibromomethane and methyl iodide. Atmos. Chem. Phys. 13, 8915–8934 (2013).
-
Maas, J. et al. Simulations of anthropogenic bromoform indicate high emissions at the coast of East Asia. Atmos. Chem. Phys. 21, 4103–4121 (2021).
-
Hossaini, R. et al. The increasing threat to stratospheric ozone from dichloromethane. Nat. Commun. 8, 15962 (2017).
-
Prados-Roman, C. et al. A negative feedback between anthropogenic ozone pollution and enhanced ocean emissions of iodine. Atmos. Chem. Phys. 15, 2215–2224 (2015).
-
Hurrell, J. W., Hack, J. J., Shea, D., Caron, J. M. & Rosinski, J. A new sea surface temperature and sea ice boundary dataset for the Community Atmosphere Model. J. Clim. 21, 5145–5153 (2008).
-
Orbe, C. et al. Tropospheric transport differences between models using the same large-scale meteorological fields. Geophys. Res. Lett. 44, 1068–1078 (2017).
-
Chrysanthou, A. et al. The effect of atmospheric nudging on the stratospheric residual circulation in chemistry–climate models. Atmos. Chem. Phys. 19, 11559–11586 (2019).
-
Davis, N. A. et al. A comprehensive assessment of tropical stratospheric upwelling in the specified dynamics Community Earth System Model 1.2.2—Whole Atmosphere Community Climate Model (CESM (WACCM)). Geosci. Model Dev. 13, 717–734 (2020).
-
Davis, N. A., Callaghan, P., Simpson, I. R. & Tilmes, S. Specified dynamics scheme impacts on wave-mean flow dynamics, convection, and tracer transport in CESM2 (WACCM6). Atmos. Chem. Phys. 22, 197–214 (2022).
-
Meinshausen, M. et al. The RCP greenhouse gas concentrations and their extensions from 1765 to 2300. Clim. Change 109, 213–241 (2011).
-
Alsing, J. & Ball, W. BASIC composite ozone time-series data, version 3. Mendeley Data https://doi.org/10.17632/2mgx2xzzpk.3 (2019).
-
Villamayor, J. et al. Dataset for very short-lived halogens amplify recent and future ozone depletion trends in the tropical lower stratosphere – Villamayor et al., 2023 – NCC, version 1. Mendeley Data https://doi.org/10.17632/bmjnwmdd2s.1 (2023).
Acknowledgements
This study received funding from the European Research Council Executive Agency under the European Union’s Horizon 2020 Research and Innovation Programme (project ERC-2016-COG 726349 CLIMAHAL). The CESM project, which is supported primarily by the NSF, is led by the National Center for Atmospheric Research (NCAR), which is a major facility sponsored by the NSF under cooperative agreement 1852977. Computing resources, support and data storage were provided by the Climate Simulation Laboratory at NCAR’s Computational and Information Systems Laboratory, sponsored by the NSF.
Author information
Authors and Affiliations
Contributions
A.S.-L. designed the research. J.V., F.I.-S., C.A.C. and A.S.-L. initialized the study in collaboration with Q.L. and R.P.F.; J.V. and F.I.-S. performed the CESM simulations with the help of C.A.C. All authors discussed the findings and commented on the manuscript. J.V. wrote the manuscript with contributions of all authors.
Corresponding author
Correspondence to
Alfonso Saiz-Lopez.
Ethics declarations
Competing interests
The authors declare no competing interests.
Peer review
Peer review information
Nature Climate Change thanks Seok-Woo Son and the other, anonymous, reviewer(s) for their contribution to the peer review of this work.
Additional information
Publisher’s note Springer Nature remains neutral with regard to jurisdictional claims in published maps and institutional affiliations.
Extended data
Extended Data Fig. 1 Time evolution of reactive halogens entering the tropical LS.
Tropical-mean mixing ratios of reactive inorganic halogens (Cly, Bry and Iy) injected in the LS (that is, the 30° S- 30° N mean mixing ratios at the 85 hPa level). Colored curves correspond to mixing ratios from each VSLS experiment (color code in the legend). Straight lines indicate the linear regression over 1998–2018 and their trend is indicated in colored values in units of pptv year−1. Asterisks indicate trend values that are significant according to a student t-test at the 90% confidence level.
Extended Data Fig. 2 Concentrations of anthropogenic VSLS species considered.
Global-mean surface mixing ratio of the major anthropogenic VSL-Cl compounds (CH2Cl2, CHCl3 and C2Cl4) included as lower boundary conditions in the future projection simulations with (blue) lower-limit and (red) upper-limit emission scenarios.
Extended Data Fig. 3 Long-term ozone change by 2100.
Latitude-height profile of the ensemble-mean stratospheric ozone change averaged across 2080–2099 relative to the 1998–2018 mean represented by (a) the UppLim6.0 and (b) LowLim8.5 simulations. Equivalent results for the LowLim6.0 and UppLim8.5 are shown in Fig. 3.
Extended Data Fig. 4 Future long-term evolution of LS ozone in high latitudes.
Indices of the change of 20-year mean ozone concentration anomalies averaged in 100–200hPa and 50°–90° latitudes of the Northern (NH) and the Southern Hemisphere (SH) relatives to the 1998–2018 mean represented by (a) the (solid red line) UppLim8.5 and (solid blue line) LowLim8.5 simulations and (b) the (dashed red line) UppLim6.0 and (dashed blue line) LowLim6.5 simulations. Indices represent the 4-member ensemble-mean values ± the 95% confidence interval.
Extended Data Fig. 5 Projected tropical upwelling.
Change of the 20-year moving mean vertical wind in the tropical LS relative to the 1998–2018 average represented by future projections: blue/red consider the lower/upper limit scenarios of anthropogenic VSLS emissions and dashed/solid lines consider the RCP6.0/8.5 concentration pathways (color code in the legend). Indices represent the 4-member ensemble-mean values ± the 95% confidence interval.
Supplementary information
Supplementary Information
Supplementary Sections S1–S5.
Rights and permissions
Open Access This article is licensed under a Creative Commons Attribution 4.0 International License, which permits use, sharing, adaptation, distribution and reproduction in any medium or format, as long as you give appropriate credit to the original author(s) and the source, provide a link to the Creative Commons license, and indicate if changes were made. The images or other third party material in this article are included in the article’s Creative Commons license, unless indicated otherwise in a credit line to the material. If material is not included in the article’s Creative Commons license and your intended use is not permitted by statutory regulation or exceeds the permitted use, you will need to obtain permission directly from the copyright holder. To view a copy of this license, visit http://creativecommons.org/licenses/by/4.0/.
About this article
Cite this article
Villamayor, J., Iglesias-Suarez, F., Cuevas, C.A. et al. Very short-lived halogens amplify ozone depletion trends in the tropical lower stratosphere.
Nat. Clim. Chang. (2023). https://doi.org/10.1038/s41558-023-01671-y
-
Received: 29 July 2022
-
Accepted: 18 April 2023
-
Published: 25 May 2023
-
DOI: https://doi.org/10.1038/s41558-023-01671-y


