

State-of-the-art general circulation models (GCMs) forced with greenhouse gas emission scenarios project a reduction of annual precipitation over a broad area of North America south of 35° N (ref. 10). While wintertime precipitation is robustly projected to decline in this region due to a poleward expansion of the subtropical dry zones11, summertime precipitation projections remain uncertain. This is due to a weak consensus across GCMs10 and incomplete comprehension of the mechanisms through which global warming will impact the summertime North American monsoon (NAM). The NAM is shaped by both the complex regional geography (Supplementary Fig. 1) and remote larger-scale drivers2, 12, which makes its simulation challenging7, 13. GCMs project a June–July reduction and a September–October increase in precipitation in the monsoon region4, 9. This early-to-late redistribution of rainfall has been conjectured to arise from two competing mechanisms14: a stronger tropospheric stability due to a remote sea-surface temperature (SST) rise in spring that persists through early summer (a remote mechanism); and increased evaporation and near-surface moist static energy, driven by larger radiative fluxes at the surface (a local mechanism). The local mechanism is speculated to overcome the stabilizing effect of remote SST rise at the end of the summer9. However, the coarse horizontal resolution and existence of SST biases in coupled GCM simulations raise the question of how reliable such projections are for the NAM, which involves interactions across many spatial and temporal scales12.
Horizontal resolution is critical for adequately representing the NAM in models. It has been recently shown8 that GCMs with horizontal grid spacing coarser than 100 km (as most models participating in the Coupled Model Intercomparison Project, Phase 3 and 5, CMIP3 and CMIP5) do not accurately resolve the summertime low-level flow along the Gulf of California (GoC), with detrimental impacts on simulated precipitation in parts of the southwestern US1, 2. For this reason, limited-area regional climate models have been used, suggesting drying of the monsoon region with warming5. Yet regional climate models lack two-way coupling with the larger-scale circulation and suffer from inherent boundary condition biases15, making them a questionable tool for studying the climate change response.
GCM simulations of North American climate are affected by SST biases. In particular, negative SST anomalies in the North Atlantic can substantially influence the North Atlantic subtropical high through the upstream influence of a Gill-type Rossby wave response16, 17, 18. This results in unrealistically strong easterly low-level moisture flux across the Caribbean region, causing the well-known monsoon retreat bias—that is, excessive monsoonal precipitation in the fall7, 13. These biases are thus a substantial source of uncertainty for the projected NAM response to CO2 forcing.
To address these issues, here we investigate the response of the NAM to increased CO2 and its sensitivity to both horizontal resolution and SST biases with the high-resolution (0.5° × 0.5° in the land/atmosphere) Forecast-Oriented Low Ocean Resolution (FLOR) model19, 20, developed at the National Oceanic and Atmospheric Administration (NOAA) Geophysical Fluid Dynamics Laboratory (GFDL). In addition to the standard configuration, the model can be run at coarser horizontal resolution (LOAR, 2° × 2° in the land/atmosphere) or in a flux-adjusted version (FLOR-FA; see Methods).
Compared to LOAR, increased horizontal resolution in FLOR allows for a better representation of the fall retreat at the end of the warm season (Fig. 1f) and a more realistic pattern of near-surface moist static energy (Supplementary Fig. 2). FLOR also better resolves the seasonal cycle of low-level moisture flux along the GoC (Supplementary Fig. 3) and synoptic-scale variability within the monsoon8. These factors combine to create a more realistic simulation of the spatial pattern of mean rainfall (Fig. 1d) and the seasonal evolution of rainfall (Fig. 1f).
a–e, Time-mean (July–August) precipitation (shading) and moisture flux (vectors) for GPCC (1971–2010) (a), MERRA reanalysis (1979–2010) (b), LOAR (c), FLOR (d), and FLOR-FA control runs (e) (see Table 1 for description of experiments). In a, the black contour delimits the area used for averaging over the North American monsoon in f, and the magenta line is the transect used for vertical cross-sections in Fig. 3. f, Seasonal cycle of monthly precipitation averaged over the North American monsoon domain in observations (red), and LOAR (blue), FLOR (cyan), and FLOR-FA (black) simulations; shading denotes the interannual variability spread in observations.
To assess the impact of SST biases7, 13, we contrast the free-running coupled FLOR with its flux-adjusted version, FLOR-FA. The flux adjustment adds a modification term to surface fluxes of enthalpy, momentum, and freshwater, reducing SST biases in the basic state (Supplementary Fig. 4b), and leading to a realistic GoC SST annual cycle (Supplementary Fig. 5). Globally, flux adjustment improves the simulations of tropical cyclones20, trade winds, dry zones in the Pacific, and El Niño21. Specifically to the NAM, one important improvement is the more realistic representation of the monsoon retreat (Fig. 1f). Other regional improvements include better representation of the high near-surface moist static energy along the GoC (Supplementary Fig. 2e), the GoC low-level jet (Supplementary Fig. 3), the Caribbean low-level jet, and the East Pacific Intertropical Convergence Zone. These results quantify that the separate impacts of both increased horizontal resolution and SST bias reduction enhance the simulation of the present-day NAM. The improvements seen in FLOR-FA suggest that this model is an excellent tool for investigations of the monsoon response to climate change.
When atmospheric CO2 concentration is doubled (2CO2_FLOR-FA versus CTRL_FLOR-FA; Table 1), no statistically significant change is seen in mean June precipitation over the NAM region (Fig. 2a). A significant rainfall reduction is instead observed during July–August both in the core NAM region south of 28° N and in its northern edge north of 28° N (Supplementary Fig. 6). Because of the large difference in mean summertime precipitation, this drying is substantial in percentage terms primarily in the northern edge of the monsoon (~40%), becoming increasingly smaller south of 28° N (Fig. 2b). The drying persists—albeit weakened—over Arizona and northwestern Mexico during September–October, with no significant precipitation changes seen along the monsoon coastal regions (Fig. 2c). Similar results are found in a second ensemble member, and in additional runs at 25 km atmospheric horizontal resolution (not shown). These trends are in line with observations, which suggest that precipitation has decreased in Arizona in recent decades22.
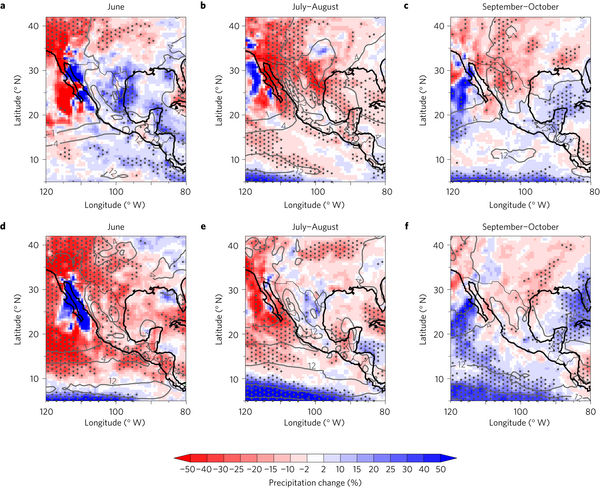
a–c, Percentage precipitation change induced by CO2 doubling in FLOR-FA simulations (%, colour shading; 2CO2_FLOR-FA minus CTRL_FLOR-FA) in June (a), July–August (b), and September–October (c). d–f, As in a–c, but for FLOR simulations (2CO2_FLOR minus CTRL_FLOR). Grey contours denote climatological values of precipitation (mm d−1) in the respective control runs. Stippling indicates regions where precipitation differences are statistically significant at the 5% level on the basis of a t-test.
What determines the precipitation reduction over land during the mature monsoon season? We answer this question by estimating changes in the vertical buoyancy23

induced by temperature and specific humidity changes. Here h10m is the near-surface moist static energy and h∗ the saturation moist static energy (see Methods). Figure 3 illustrates changes in buoyancy and cumulus convective mass flux under doubled CO2 concentrations following a transect from the tropical eastern Pacific across the Sierra Madre Occidental into the southwestern US (Fig. 1a). In June, convection is mostly unchanged over the western slopes of the Sierra Madre Occidental and south of 32° N, consistent with modest, insignificant changes in vertical stability (Fig. 3a, d). In July–August, buoyancy decreases substantially between the lifted condensation level and the level of free convection over the most actively convecting regions on the Sierra Madre Occidental western slopes (Fig. 3b). Consistently, cumulus convective mass fluxes weaken substantially over the Sierra Madre Occidental western slopes (10–30%) and elevated terrain in Arizona (25–50%; Fig. 3e). In September–October, the region of negative buoyancy differences narrows and disappears almost everywhere except north of 30° N. These patterns are consistent with those of convective mass flux changes (Fig. 3c, f).
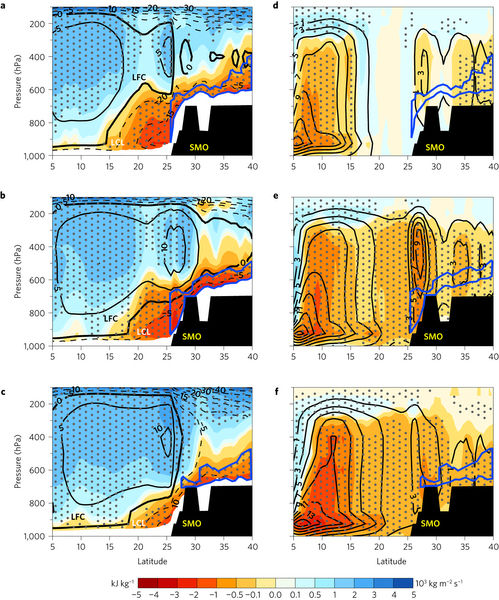
a–c, Difference in June (a), July–August (b), and September–October (c) mean buoyancy (kJ kg−1) between doubled CO2 and control FLOR-FA simulations (colour shading; see Methods for details on buoyancy calculations). Stippling denotes statistical significance, black lines denote climatological values of buoyancy (negative values are dashed), LFC the level of free convection (zero buoyancy), and LCL the lifted condensation level. Buoyancy values below the LCL are not shown because the relationship between buoyancy and moist static energy does not hold for an unsaturated parcel. d–f, As in a–c, but for the cumulus convective mass flux (103 kg m−2 s−1). The vertical transect is at 108° W (pink line in Fig. 1a) and intersects the Sierra Madre Occidental (SMO) at approximately 28° N. The blue line encircles areas over land where there is a significant buoyancy negative anomaly.
Importantly, when SST biases are not substantially reduced (that is, 2CO2_FLOR versus CTRL_FLOR), the response to CO2 doubling is different (Fig. 2d–f), with a drier (20–30% rainfall reduction) June over both the southwestern US and most of western Mexico (Supplementary Fig. 6), a substantially unaffected July–August (statistically insignificant differences), and a more pronounced tendency for larger rainfall rates along the coastal areas of western Mexico in September–October. This is consistent with the progressive increase from June to October in evaporation anomalies (Supplementary Fig. 7a–f) and decrease in sensible heat flux anomalies (Supplementary Fig. 7g–l). The changes evident in FLOR without flux adjustment follow the consensus based on CMIP3 and CMIP5 model assessments4, 9, 14, which invokes a late summer evaporation increase—and with it a near-surface moist static energy increase—that balances the larger radiative fluxes at the surface. This compensation results in the suppression or even reversal of the early summer rainfall reduction (local mechanism). This similarity between FLOR and most of the CMIP5 models may be due indeed to their similar SST biases16.
This picture is notably different in the southwestern US and northwestern Mexico when SST biases are reduced (2CO2_FLOR-FA versus CTRL_FLOR-FA): the strongest rainfall decrease occurs in July–August (Fig. 2b) rather than in June. This more persistent drying in FLOR-FA reduces soil moisture availability and evaporation; hence, the local mechanism cannot reverse the drying, which persists until late summer. SST biases can thus substantially alter the intensity and effectiveness of the local mechanism9, 14, leading to a change in the sign of the monsoon response to CO2 forcing. One caveat is that the northernmost GoC is not resolved in FLOR8; this may artificially reduce precipitation in the Southwest US24 and weaken the impact of the local mechanism during the late summer season.
The sensitivity of simulated rainfall changes to SST bias raises the question of how robust the projections shown in Figs 2 and 3 are and what is the main driver of rainfall change. Although tropical precipitation changes produced by greenhouse gas warming are expected to be locally correlated with SST changes25, it has been argued that the precipitation response over land is insensitive to patterns of SST change26. To understand the cause of our simulated precipitation changes, we use additional FLOR simulations in which SSTs are relaxed to a prescribed distribution (Table 1): (1) CLISST, where SSTs are relaxed to climatological 1971–2012 observed values; (2) 2CO2, where CO2 concentration is doubled and SSTs are relaxed to climatological values as in CLISST; (3) +2K, where SSTs are relaxed to climatological values augmented by a uniform 2 K anomaly; (4) 2CO2_+2K, which is a combination of +2K and 2CO2; and (5) 2CO2_pattern, where CO2 concentration is doubled and SSTs are relaxed to climatological values augmented by a nonuniform anomaly pattern derived from the long-term 2CO2_FLOR experiment, with global mean warming of +2.1 K. As shown in Fig. 4, the July–October NAM drying is in large part reproduced by 2CO2_pattern. Direct CO2 forcing27 causes a significant increase in June precipitation due to land and lower-troposphere warming28, and compensates for the drying effect of SST rise. Although a uniform +2K warming generally increases convective inhibition over land and decreases precipitation, the spatial structure of the SST rise (2CO2_pattern minus 2CO2_+2K) provides an important contribution to the total changes, as it leads to an additional and substantial reduction of rainfall (Fig. 4b). This additional drying is explained by the impact of spatial variations in the SST rise, characterized by enhanced near-equatorial warming and off-equatorial relative cooling in the eastern subtropical Pacific (Fig. 4c). As a consequence, subtropical subsidence intensifies as the sea surface warms more at the equator than in the subtropics. This response is in line with the ‘warmer-get-wetter’ paradigm25; here we highlight the potential consequences of this response for the NAM region.
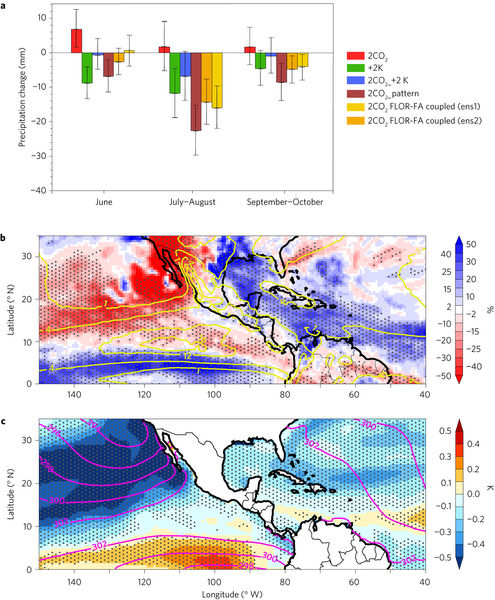
a, North American monsoon area-averaged (defined in Fig. 1) precipitation change attributed to each experiment (Table 1): 2CO2 (red), +2K (green), 2CO2_+2K (blue), 2CO2_pattern (brown) and the coupled 2CO2_FLOR-FA simulations (yellow for ensemble member 1, orange for ensemble member 2). Error bars denote the 95% confidence interval. b, Percentage July precipitation change induced by patterns of SST anomalies (2CO2_pattern minus 2CO2_+2K). Yellow contours denote the 2CO2_+2K climatology (mm d−1). c, Areas of SST cooling and warming in the 2CO2_pattern run relative to the 2CO2_+2K run (uniform +2 K rise). Pink contours denote the 2CO2_+2K climatology (K). In both b,c, stippling indicates regions where precipitation differences are statistically significant at the 5% level on the basis of a t-test.
The strong sensitivity of the NAM response to SST biases shows that these may be a large source of uncertainty for regional hydroclimate change29. Here we demonstrate that, when SST biases are substantially reduced, a CO2 increase causes a reduction of summertime precipitation in the NAM region, especially over northwestern Mexico and the southwestern US (~40%). These precipitation reductions are driven by the global mean SST rise, but, unlike what is seen in other tropical and subtropical land regions26, they are substantially amplified by sea-surface warming patterns. Interestingly, direct CO2 radiative forcing27, 28 has a negligible impact on the NAM, a circumstance that, along with the high interannual and interdecadal variability of NAM rainfall2, may explain the difficulty in detecting rainfall trends from historical observations30.
Although our results are based on a single climate model, this model is integrated in multiple configurations and has a highly realistic representation of the monsoon compared to CMIP models. Our results highlight the possibility of a strong precipitation reduction in the northern edge of the monsoon in response to warming, with potential consequences for regional water resources, agriculture and ecosystems3. In addition to this mean precipitation response, changes in precipitation extremes22, 31 with warming will also have a significant impact in the monsoon region’s hydrology. We will explore them in future studies. Further study of the sensitivity to key parameterized processes such as cumulus convection and land surface physics will improve understanding of the monsoon response. Additional progress is within reach, as increasing horizontal resolution in state-of-the-art GCMs will soon allow new comparative and idealized studies in this critical region.


