

Last year was warmer, wetter and sunnier than average for most of the UK, and finished as the 11th warmest, 11th wettest, and 15th sunniest year on record.
But perhaps one of the most remarkable aspects of the weather in 2019 was that in the same calendar year the UK experienced the highest winter and summer temperatures on record.
A warmer and wetter year with a number of notable high temperature records within it reflects the general climate trends that scientists have observed during recent decades.
While individual extreme weather events are primarily the result of specific coincidence of meteorological conditions, the UK climate is changing. This means that when the right weather conditions do occur, the likelihood of seeing certain types of weather records being broken has changed.
This is something we are observing in the UK with many more high temperature records being set compared to low temperature records. Here, I review some of the extremes from 2019.
The year overall
Average UK temperatures for the whole of 2019 were widely 0.5-0.7C above the long-term average and generally slightly cooler than 2018.
You can see the spatial patterns in the maps below. For example, the dark blue shading in the middle map shows the relatively wet year for the Midlands, while the dark yellows in the right-hand map show that the eastern UK saw greater-than-average amounts of sunshine last year.
Maps of UK annual average temperature (left) rainfall (middle) and sunshine duration (right) for 2018. Credit: Met Office
| Average Temperature | Rainfall | Hours of sunshine | |||
|---|---|---|---|---|---|
| Actual (C) | Anomaly (C) | Actual (mm) | Anomaly (%) | Actual (hours) | Anomaly (%) |
| 9.4 | 0.6 | 1240 | 107 | 1455 | 106 |
UK average temperature, accumulated rainfall and hours of sunshine statistics for 2019. Anomalies are presented relative to 1981-2010 average.
All of the Top 10 warmest years for the UK have occurred since 2002 and only three of the last 20 years have been cooler than the 1981-2010 average of 8.8C (those years being 2010, 2012, and 2013).
| Rank | Year | Average Temperature (degrees C) | |
|---|---|---|---|
| 1 | 2014 | 9.91 | |
| 2 | 2006 | 9.73 | |
| 3 | 2011 | 9.64 | |
| 4 | 2007 | 9.59 | |
| 5 | 2017 | 9.56 | |
| 6 | 2003 | 9.50 | |
| 7 | 2018 | 9.49 | |
| 8 | 2004 | 9.47 | |
| 9 | 2002 | 9.47 | |
| 10 | 2005 | 9.45 | |
| 11 | 2019 | 9.42 |
Top 11 warmest years for the UK. Data source
For specific months, last year recorded the second warmest February on record, the eighth warmest July and 10th warmest March, with April (15th) and August (13th) also being notably warmer than average. The coldest month relative to average was November with an anomaly of -0.9 C, but this was not exceptional.
For rainfall, the year opened with a dry January and February concluding a dry winter season. However, periods of intense rainfall resulted in flooding in parts of the country through the summer and autumn periods and set a number of notable records, including the wettest August on record for Scotland and the wettest Autumn across parts of central England including South Yorkshire, Nottinghamshire and Lincolnshire.
The maps below show the UK-wide monthly average temperature (top), rainfall (middle) and sunshine hours (bottom) for each month of 2019. The bold shading indicates where a month shows a particular from average.

The summer season of 2019 was rather unusual in being both notably warm (the 12th warmest on record) and wet (seventh wettest on record).
The chart below shows how the 2019 summer compares to past years in terms of both rainfall and temperature. Summers in the 21st century are shown by red dots, while blue ones show all summers on record before that.
It is notable that we have had a cluster or relatively wet summers in the UK – including 2019 – during the 21st century and that these have all been considerably warmer than comparably wet summers of the past.
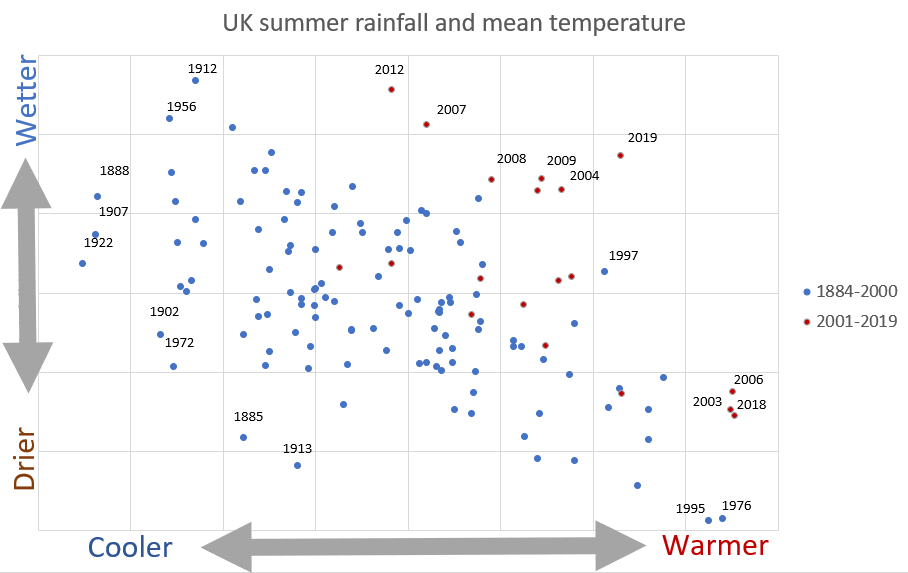
Distribution of UK summers based on average temperature (x axis) and rainfall (y axis). Dots show individual years in the 21st century (red) and from 1884 to 2000 (blue). Credit: Met Office from the HadUK-Grid dataset
Record winter temperatures
The UK experienced record-breaking warmth at the end of last year’s winter. During late February, high pressure over the near continent put the UK into a flow of exceptionally mild air from Iberia. Somewhere in the UK reached 18C every day from 21 to 27 February. On 26 February temperatures exceeded 20C at weather stations around London, western Wales and as far north as Rochdale.
This event is the first official documented occurrence of temperatures in excess of 20C during a UK winter, with many locations being 12-14C higher than the average February maximum.
This spell of weather set new national temperature records for UK, England, Wales and Scotland. Temperatures were significantly higher than during the previous record warm February day of 13 February 1998. A new national high minimum temperature record of 13.9C was also set at Achnagart (Highland) on 23 February. This event was in notable contrast to late February and early March of 2018 when national records were being set for low temperatures.
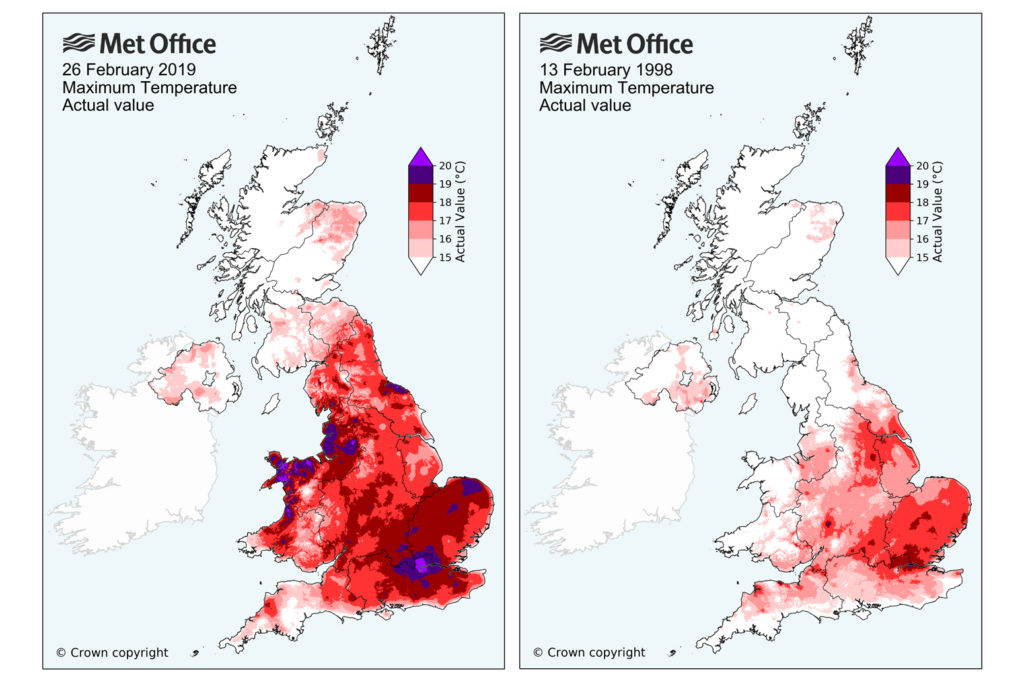
Maximum temperature map for 26 February 2019 (left) and 13 February 1998 (right). Dark red and purple shading indicate areas with the highest temperatures. Credit: Met Office
Record summer temperature
Last year’s summer also saw records tumble. During late July 2019, an exceptional plume of southerly air originating from North Africa resulted in temperatures reaching the low 40Cs across parts of western Europe and setting new national temperature records in Belgium, Netherlands and Germany.
On 25 July, daily maximum temperatures reached a new national record for the UK with 38.7C recorded at Cambridge Botanic Gardens, exceeding the previous UK record of 38.5C recorded at Faversham (Kent) on 10 August 2003.
Extremely high temperatures were again more widespread than in previous extreme heat events with 34 UK observing stations recording temperatures above 36C and three locations exceeding 38C.
The air mass also brought thunderstorms and torrential downpours during the evening across parts of southeast England. Cloud cover started to build across some areas during the afternoon. Without this cloud cover affecting London and surrounding areas in the early afternoon it would have been plausible for temperatures to have reached even higher values than those recorded at Cambridge.
A rapid attribution study, published in early August, showed that the heat in Cambridge was made around “20 times more likely” by human-caused warming.
The maps below shows how maximum summer temperatures compared between the heatwave in 2019 (left) and the deadly European heatwave of 2003 (right).
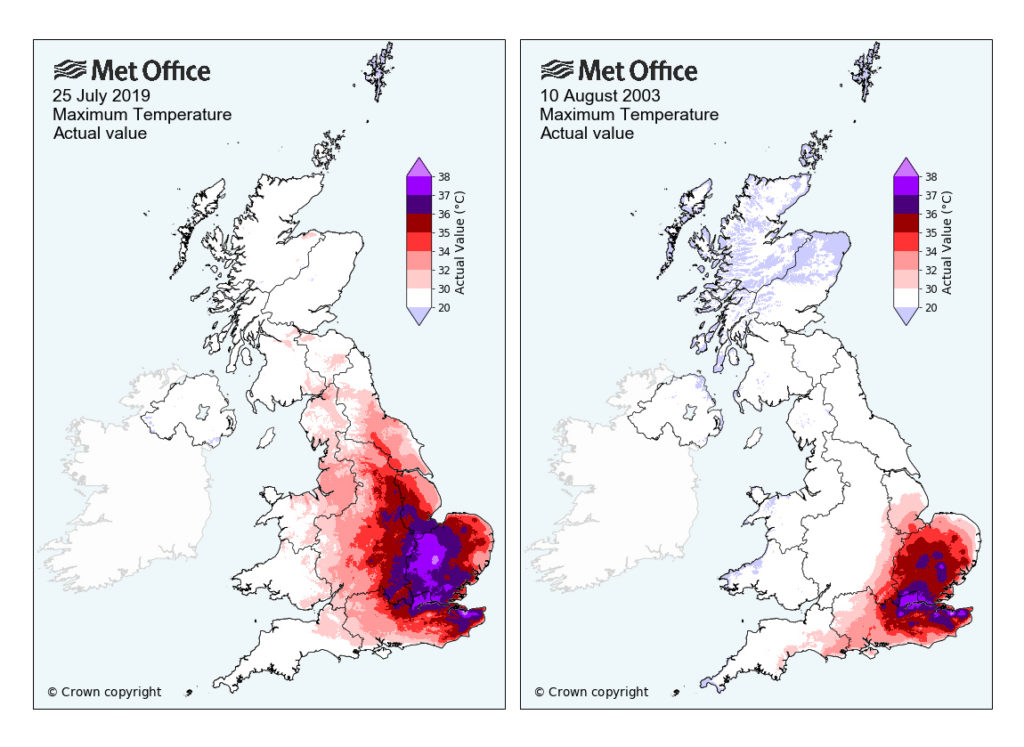
Maximum temperature map for 25 July 2019 (left) and 10 August 2003 (right). Credit: Met Office
Record December day
Last year even closed with a potential new record high temperature for December with 18.7C measured at Achfary (Sutherland) on 28th December. This was the consequence of a phenomenon known as the “Foehn effect”. A southerly flow of air was pushed up and over the Scottish Highlands, mixing with drier air aloft and losing moisture, such that it warmed considerably as it descended on the leeside of the mountains.
Many of the UK all-time temperature records during the winter months are held by locations in northern Scotland or north Wales and relate to the Foehn effect because it is capable of pushing temperature far higher than normal climatological values.
Extreme rainfall
It was not just temperatures that set new records in 2019. For example, slow moving weather fronts resulted in some spells of exceptionally wet weather during mid-June. Over the three day period from 10 to 12 June, parts of Lincolnshire recorded approximately 250% of normal June rainfall and on 10 June several rain gauges recorded totals in excess of 80-96mm of rainfall. The peak hourly rainfall rate did not exceed 10mm per hour, which suggests the high totals were a consequence of persistent rain over an extended period of time, rather than an intense downpour.
Meanwhile, at the end of July intense, thundery downpours affected the Yorkshire dales, east Cheshire and Greater Manchester causing flash flooding – 40-60mm was recorded in one hour across parts of North Yorkshire. Thousands were evacuated from Whaley Bridge area due to damage at the Toddbrook reservoir.
Persistent wet weather was a theme during the autumn season, with more slow moving frontal rain affecting many parts of central and southern England and Wales. A southerly displacement of the jet stream resulted in very high rainfall anomalies for central and north eastern parts of the country. In contrast, the north west of Scotland had a drier-than-average autumn.
On 7November, 50-100mm of rain fell in a band from Sheffield to the Humber estuary with flooding on the river Don. The observing station at Sheffield has records back to 1883. The 63.8mm that fell in Sheffield on the 7 November was the wettest November day on record for the site and the seventh wettest day on record. Six of the 10 highest daily totals for the site have occurred since 2000.
The rain that fell in early November was falling on already saturated ground. The map below shows the rainfall totals from 22 September to 7 November for sites across central England and North Wales, displayed as a percentage of total average annual rainfall. The sites coloured pink received more than 40% of a normal year’s rainfall.
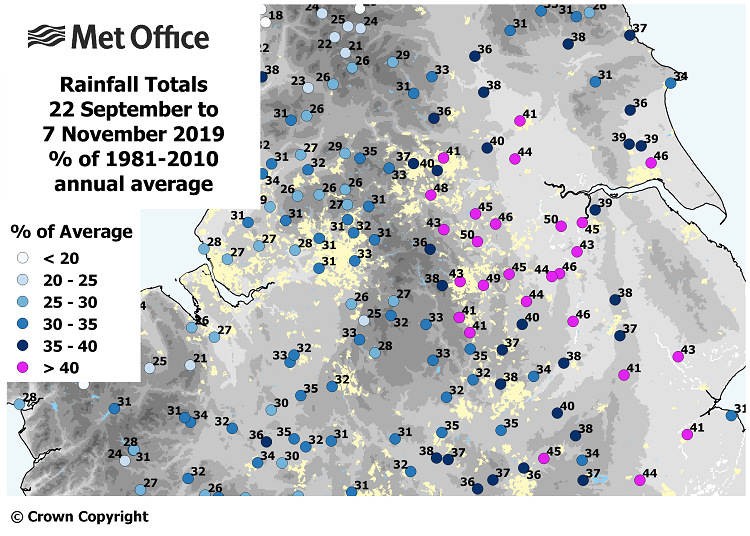
Rainfall totals from 22 September to 7 November 2019 for sites in central England and North Wales, shown as percentages of the 1981-2010 annual averages. Credit: Mike Kendon Met Office.
A decade of extremes
Now that the decade of the “2010s” (2010-2019) has concluded, my Met Office colleagues and I have reviewed a number of statistics that have been associated with this decade.
Overall, the 2010s were the second warmest and second wettest decade on record, in both cases falling slightly behind the 2000s.
The large variability in UK climate means that even with a warming trend due to global climate change we would not expect every decade to necessarily be warmer than the one preceding it. The relatively cold year of 2010, in particular, pulls down the average temperature for the 2010s, but years as cold as 2010 have been much less frequent than they used to be.
At the Met Office we monitor a range of climate and weather extremes and associated records. A paper by Mike Kendon in 2014 showed clear evidence of increases in high temperature records and decreases in low temperature records, which we would expect to occur in a warming climate.
We have recently reviewed the distribution of daily weather extremes and associated set of records (the full set of records in question are published on the Met Office website). The chart below shows the number of records associated with each decade back to the 1890s. This chart has looked at all monthly high and low temperature records for each of daily maximum (red bars) and minimum (blue) temperature.
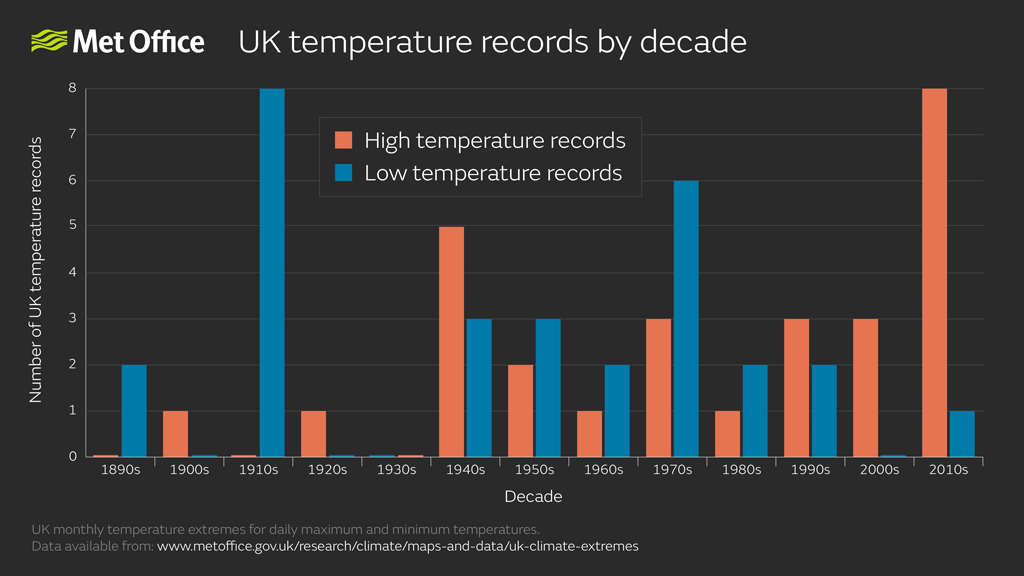
The 2010s currently hold eight high temperature records, four of which were set during 2019. In contrast, only one new low temperature record was set with -4.7C at Tredegar south Wales on 1 March 2018 – during the “Beast from the East” – being the coldest March day on record.
Looking across both the 2000s and 2010s, they hold 11 high temperature records and only one low temperature extreme. This is also in stark contrast to a century ago, for which the 1910s still hold eight low temperature records.
Variability in our weather and climate means that cold extremes can and do occur. Each of these extreme events is the result of a particular set of meteorological circumstances resulting in extreme temperatures being observed over the UK.
However, climate change has resulted in a warming climate for the UK. Therefore, this is going to be helping to tip the balance, so that when these extreme weather events do occur they are more likely to break high temperature records and less likely to break the low temperature ones.
The sporadic nature of extreme weather events means that we would not expect each successive decade to have more or fewer extremes than the one immediately preceding it, but a general increase in the frequency of high temperature extremes and decrease in low temperature extremes is expected in our future climate.
Further data, statistics and analysis are currently being reviewed and will be released in our annual State of the UK Climate report scheduled for publication in late July 2020.
The post Guest post: A Met Office review of the UK’s weather in 2019 appeared first on Carbon Brief.


