

Antarctica may seem far away for most of us, yet this remote continent contains enough ice to raise sea levels around the world by tens of metres. Its fate has important implications for coastal regions worldwide and the billions of people who live within them.
Ice currently locked up in the Antarctic ice sheet flows to the coast within rivers of ice, known as ice streams or glaciers. These flow much more rapidly than the surrounding ice.
The acceleration and retreat of the many large glaciers that drain the Antarctic ice sheet is known as “dynamic ice loss”. It stubbornly remains the largest single source of uncertainty around projections of future sea level rise (pdf).
One cause for concern is that continued global warming may cause some glaciers to cross a “tipping point” known as the “marine ice sheet instability”. A tipping point is a threshold where a small, incremental change could push a system into a completely new state.
Being able to determine if and when a tipping point might be crossed is crucial for climate projections because the resultant change is effectively irreversible. Once crossed, even reducing greenhouse gas emissions back to pre-industrial levels may not be enough to recover what is lost.
In a new study, published in the Cryosphere, my co-authors and I identify three distinct tipping points in model simulations of West Antarctica’s vast Pine Island glacier, which – if crossed – could lead to rapid and irreversible retreat. We also show that there are potential early warning indicators that signal when thresholds are approaching.
Tipping points and hysteresis
For an ice sheet to not contribute to sea level, there must be a balance between the mass lost – through melting at the ocean and the breaking off, or “calving”, of icebergs – and the mass gained through snowfall.
In a marine ice sheet, such as West Antarctica, the ice rests on ground below sea level. In this case, a situation can arise where retreat of the ice sheet becomes self-sustaining, putting the ice sheet even more out of balance. This “positive feedback” is known as marine ice sheet instability (MISI).
Marine ice sheets are vulnerable to MISI, but the positive feedback that makes this process a tipping point is driven by internal ice dynamics and is sensitive to both local and far-field conditions. This makes it difficult to classify whether a glacier has crossed a tipping point or not.
Tipping points like the MISI are an example of a “hysteresis loop”, where the response of a system to a change in conditions depends on the history of that change.
The figure below illustrates different ways that a system – such as a glacier – can respond to a forcing, such as a warming ocean. In example a), the system responds in an approximately linear fashion, with a small response to a large forcing (red arrow), which can be directly recoverable if that forcing reverses (blue arrow). For a glacier, this would mean that while warming would cause the glacier to retreat, cooling would stop – and eventually reverse – that retreat and see the glacier reestablish itself.
In example b), the system has a large response to a small forcing, but it can still be directly recovered.
However, in c), the system has two potential states (x1 and x2). When a tipping point is crossed, the system jumps onto a different branch of the hysteresis loop and returning to the previous branch becomes very difficult. This is hysteresis behaviour.
For a glacier, this could mean crossing a tipping point that sees it continue to retreat to a new, much smaller state even if global warming stopped. And, once in that new state, it would take a much larger drop in global temperatures for the glacier to regrow.
Importantly, it is worth noting that simply observing a rapid and large change in a system does not necessarily mean that a tipping point has been crossed. Instead, it could be that reversing that change would still cause an equally large reversal in the response, as shown in b) in the figure above.
The weak underbelly of Antarctica
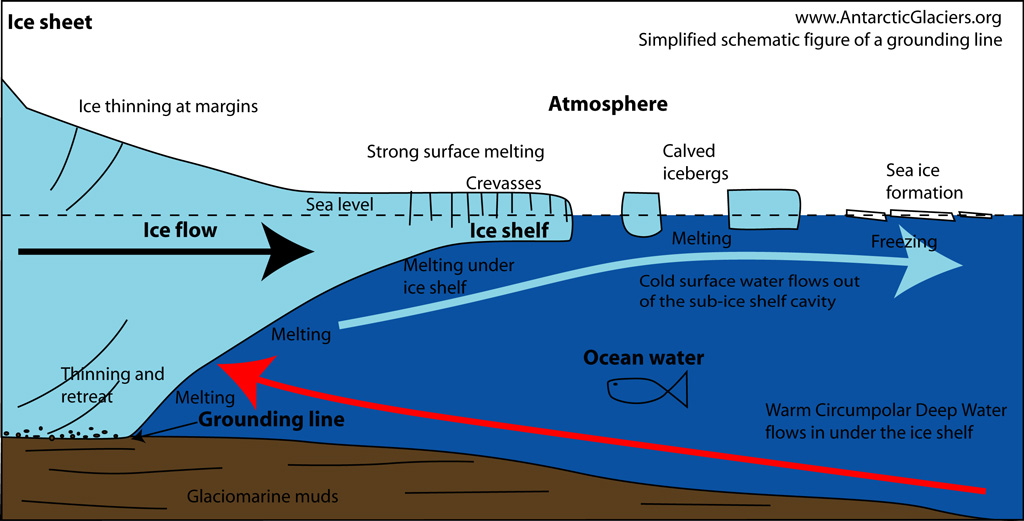
An area of West Antarctica of particular concern is the Amundsen Sea region, which has seen a rapid reduction in ice volume in recent decades. Here, warm ocean currents are transported onto the continental shelf and all the way to the grounding lines of glaciers such as Pine Island Glacier (PIG).
(The grounding line is the point at which the glacier, which is sitting on the seabed, becomes an ice shelf floating the water. It is where the ice sheet is most vulnerable to warming. As a glacier thins, more of its ice will lift off the seabed and float, causing the grounding line to retreat.)
Furthermore, PIG and the neighbouring Thwaites glacier are considered to be susceptible to the MISI. In fact, PIG has been referred to as the “weak underbelly” of the West Antarctic ice sheet.
Scientists have argued for some time that PIG could cross a tipping point, or that it already has. However, confirming this in an ice sheet model typically requires very time consuming simulations, looking thousands of years into the future.

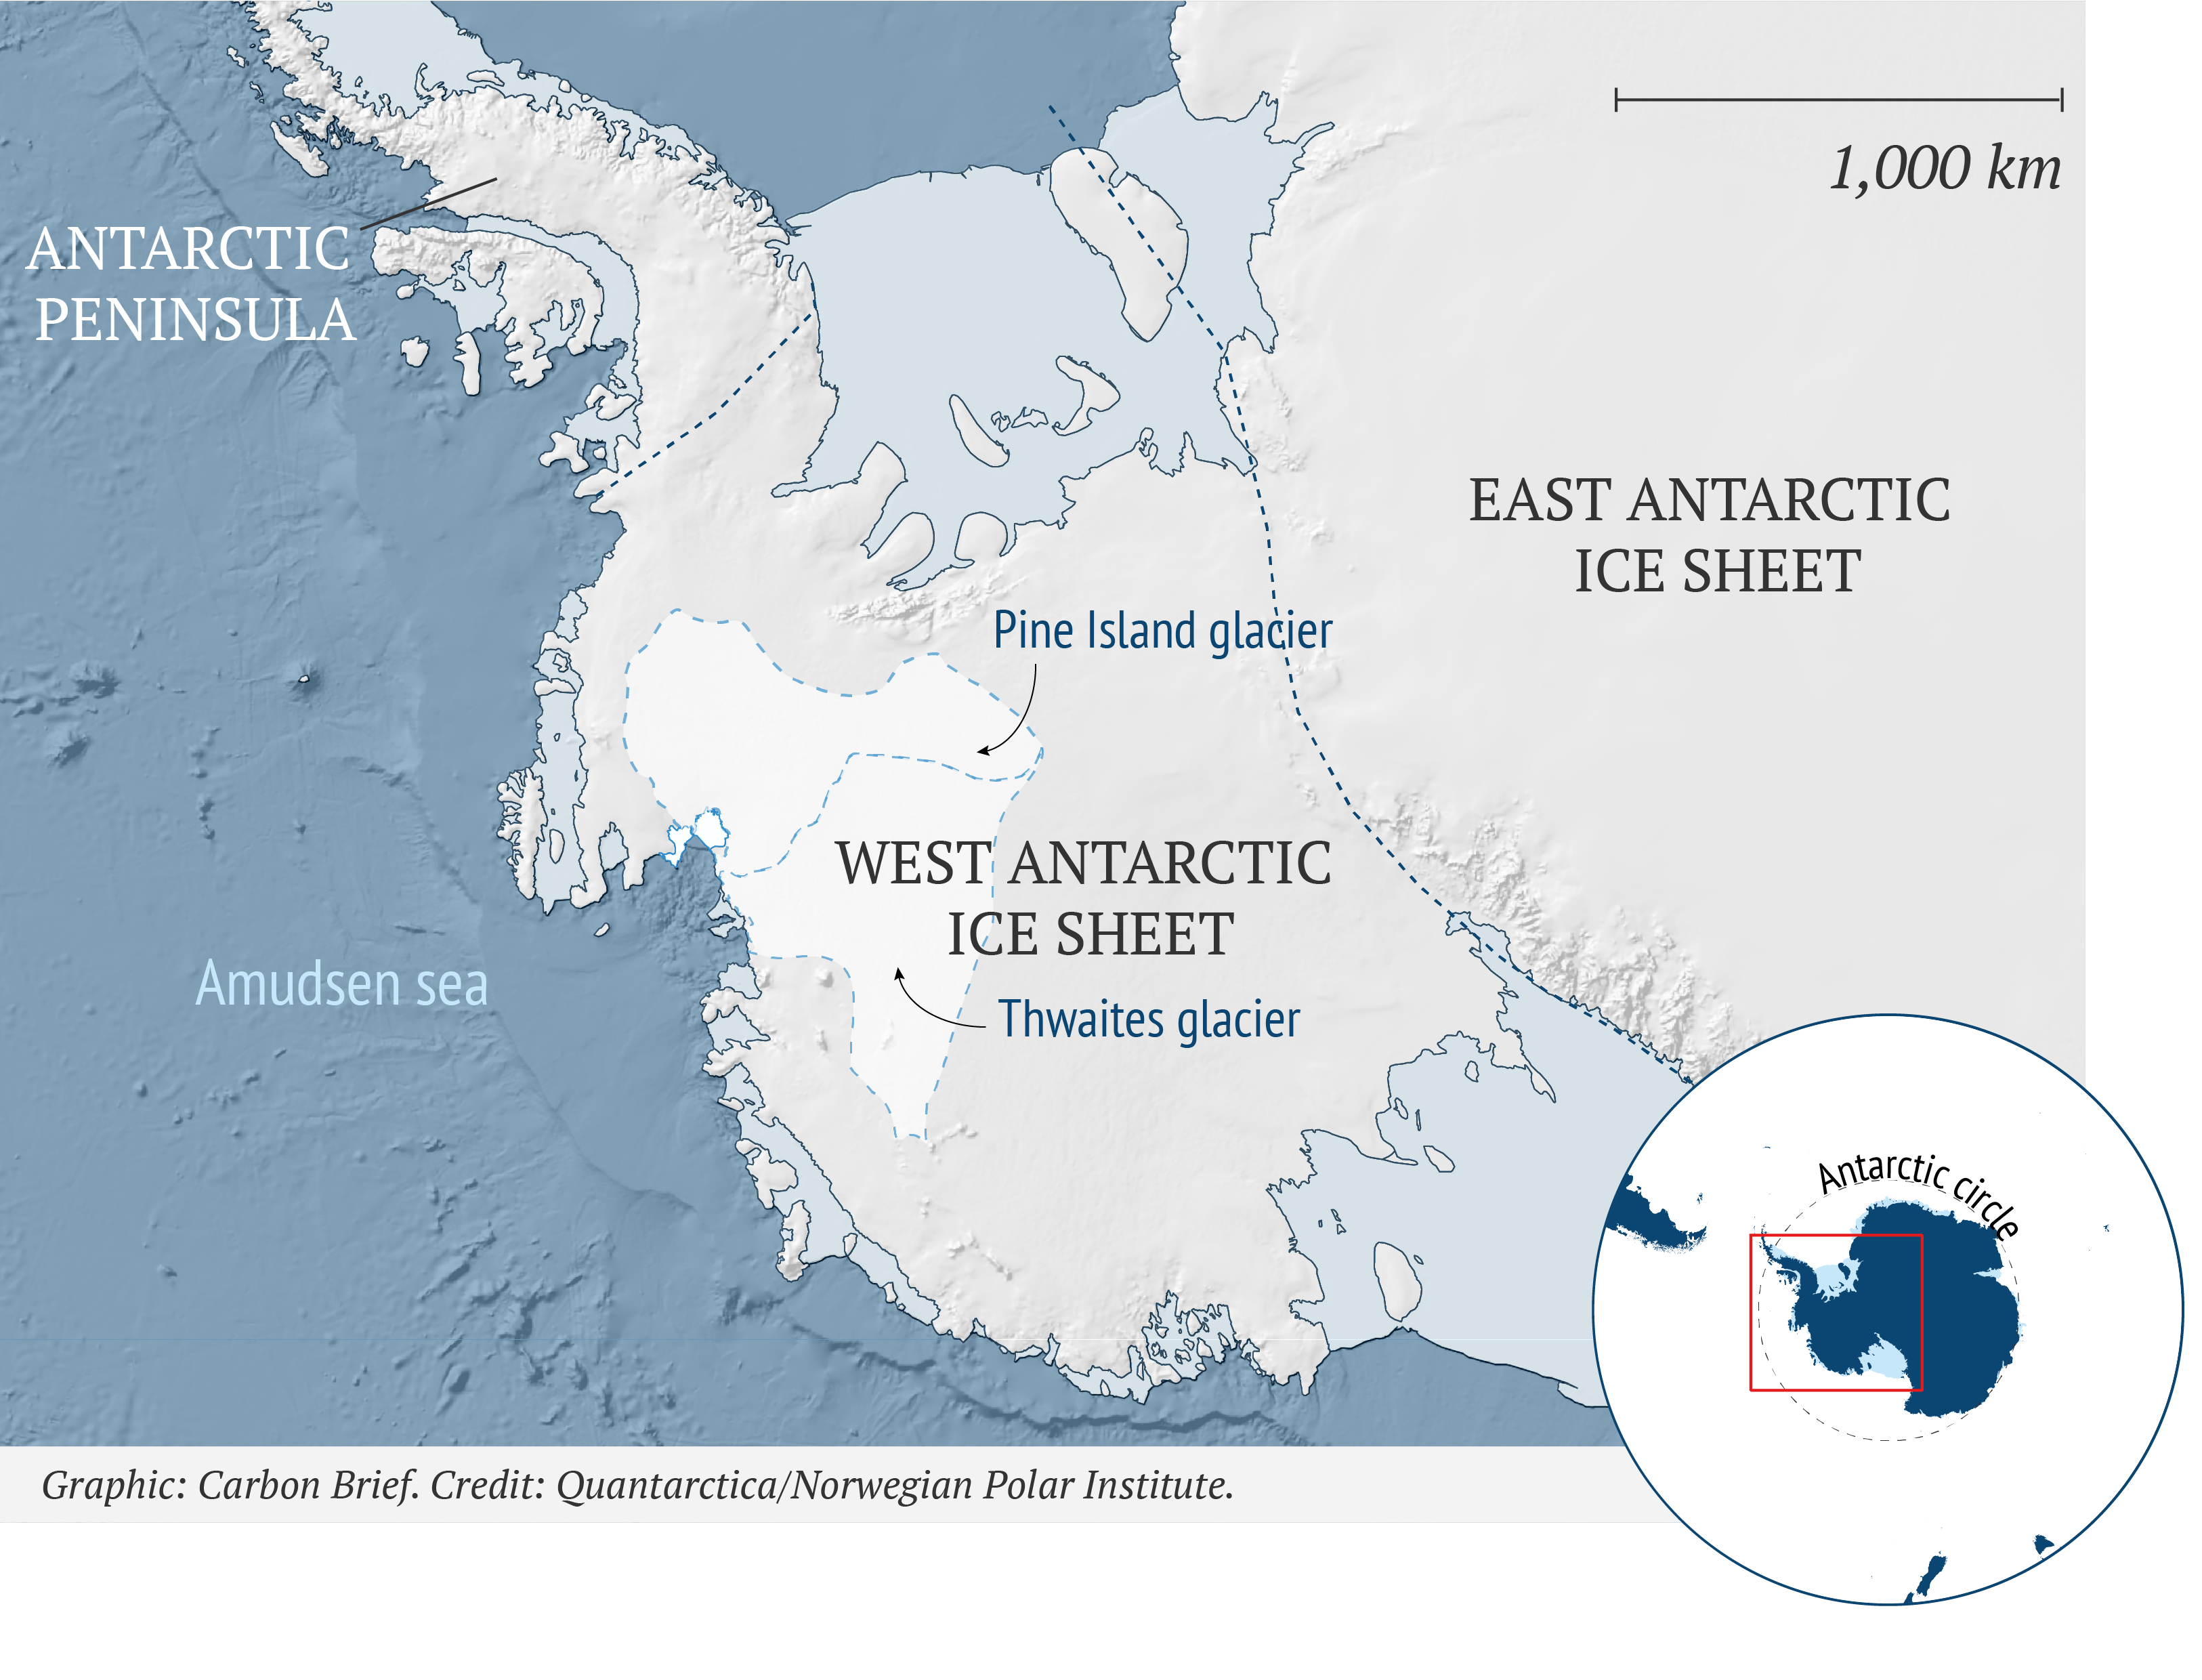
1,000 km
Antarctic
peninsula
Ronne ice shelf
East Antarctic
Ice Sheet
Pine Island glacier
South pole
West Antarctic
Ice Sheet
Transantarctic mountains
Amudsen sea
Thwaites glacier
Ross ice shelf
Graphic: Carbon Brief. Credit: Quantarctica/Norwegian Polar Institute.
For this reason, there are a large number of ice sheet models that seek to quantify how much PIG will contribute to future sea level rise, but none that rigorously establish whether the glacier will cross a tipping point. Fortunately, a methodology that has grown increasingly popular in other fields can provide useful insights into tipping point behaviour.
Early-warning indicators
Research shows that, in general, as systems approach certain types of tipping points, they start to respond more slowly to perturbations.
This behaviour is known as “critical slowing” and statistical tools called early-warning indicators (EWIs) can be used to detect it. This can provide an early-warning of an approaching tipping point. Moreover, this critical slowing proceeds until a limit is reached – the tipping point itself – and so can be used as a predictive tool.
The completely general nature of this phenomenon – and prevalence of tipping points in a wide variety of fields – means that EWIs have quickly found diverse applications. Signs of critical slowing have been found to precede wildlife population collapses, onset of epileptic seizures and crashes in financial markets, to name but a few.
That being said, there is no guarantee that critical slowing will always be detectable. Ice sheets and their glaciers pose a particular problem in this regard, since they generally respond to changes over very long timescales.
That means that the current observational record – essentially the beginning of the satellite era – is unlikely to be long enough to find these signals in existing data. Therefore, the alternative is to look in model simulations.
Tipping points of Pine Island Glacier
Our study uses state-of-the-art model simulations of PIG to explore these ideas in detail for the first time.
The ice sheet model is driven by slowly increasing temperatures, with variability in ocean conditions designed to closely mimic natural changes. An increase in the time it takes for the model to adjust to this variability – that is, critical slowing – is clearly detectable at several points in the simulation, confirming that EWIs can be applied to MISI.
We verified this response by running the model for a very long time to show that these periods of rapid retreat, identified as tipping points by EWIs, correspond to hysteresis behaviour and, ultimately, result in irreversible ice loss.
Our results are the first to rigorously establish that PIG does indeed cross tipping points in response to changing ocean conditions.
You can see these in the maps and charts below. The two maps at the top show an overhead view of simulated grounding-line positions of the PIG before and after the three tipping points. The figures at the bottom illustrate the cross-sectional view of grounding line retreat and enhanced melt during a MISI event.
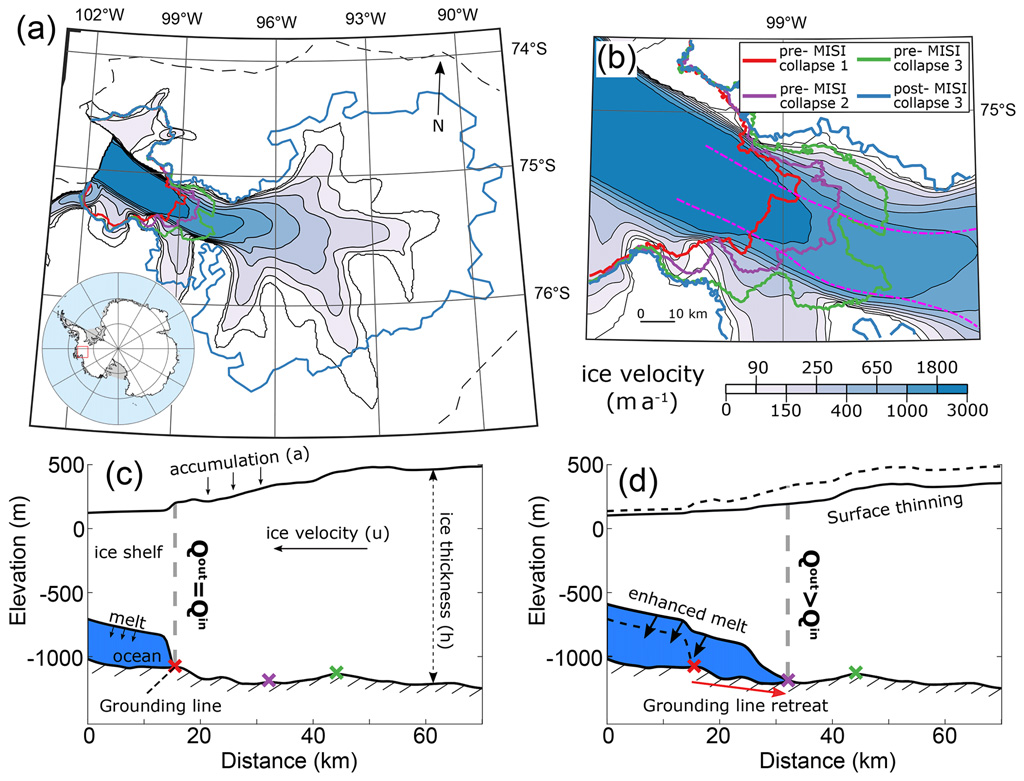
Interestingly, the EWIs are able to detect three distinct tipping points, characterised by rapid ice loss – these include two smaller ones followed by one large event that results in a complete collapse of the glacier. Without the aid of EWIs, the presence of two earlier tipping points could easily be overlooked and yet the fact that the resulting ice loss is irreversible is hugely relevant.
This is illustrated in the charts below, which show how the PIG undergoes periods of rapid, self-sustained and irreversible mass loss after crossing each tipping point (numbered blue dots). The solid line is the simulated mass loss (in sea level equivalent), while the dotted lines indicate the hysteresis behaviour, described earlier.
The right-hand chart shows a zoomed-in view on the model response before the larger tipping point (event 3) and shows the three windows that we analyse for early warning indicators (red stripes).

The model simulations also provide a good prediction of when these tipping points will be crossed, since they tend towards a critical value of one at approximately the correct time.
In this modelling study, an increase in melting equivalent to +1.2C change in ocean temperature was sufficient to drive PIG from a steady state to complete collapse.
This begs the question: how much global warming would cause a temperature change of this magnitude? Unfortunately, how the ocean currents around Antarctica will change is a very challenging topic currently occupying a large community of scientists.
However, it is expected that PIG and neighbouring glaciers will be subjected more frequently to warm ocean currents as global temperatures rise, making changes of this magnitude increasingly likely.
Furthermore, ocean currents around Antarctica can themselves cross tipping points, causing large regions that were previously sheltered from warm water to be exposed to similar conditions to those of the Amundsen Sea. In a second new paper, published in Nature Communications, my co-authors and I show the complexity of this response to warming, with initially colder waters at the glacier preceding dramatic increases in temperature. Interactions between the atmosphere, ice and ocean are difficult to model but the possibility of a tipping point in one system triggering a tipping point in another – known as a tipping cascade – presents a very real risk and a lot more research is needed in this area.
A social tipping point
Research into how humans collectively respond to tipping-point-type events tells us that uncertainty in the proximity of the threat plays a pivotal role in determining whether the group can successfully cooperate to avoid it.
If the group knows with a high degree of certainty where the threat lies, they will be far more effective in dealing with it. In fact, the change from cooperation to non-cooperation has been shown to be a “social tipping point”, such that increasing uncertainty beyond some threshold causes a sudden switch from one to the other.
The difficulty with Antarctica is that, because of the relatively slow rate of change and current contributions to sea level that perhaps do not sound very alarming to many people, the threat seems very distant.
However, the presence of tipping points driven by the MISI means that, with continued emissions, we may be committing ourselves to centuries of sustained ice loss accumulating to very significant sea level rise.
This, therefore, is a strong motivation for glaciologists to continue to strive to better understand processes such as the MISI and where these tipping points might lie in the future.
The post Guest post: Identifying three ‘tipping points’ in Antarctica’s Pine Island glacier appeared first on Carbon Brief.


