

Dr Carl-Friedrich Schleussner is a research group leader at Humboldt University and head of climate science and impacts at Climate Analytics, and Marina Andrijevic is a research analyst at Climate Analytics and a doctoral student on the EmBARK project.
The scientific literature has clearly established the multiple benefits of stringent mitigation action to achieve the 1.5C temperature goal and limit the impacts of climate change.
Likewise, the mitigation requirements for achieving the 1.5C limit have been studied intensively for a range of “Shared Socioeconomic Pathways” (SSPs), which examine how global society, demographics and economics could evolve over the next century.
Yet, the SSP framework – and indeed most of the wider climate impact and economic literature – largely overlook the need to quantify scenarios for how society adapts to the unavoidable impacts of climate change.
As a result, adaptation options in impact assessments risk being either highly stylised, or not implemented at all – neither of which is realistic and certainly not in a globally uniform way. A recent example comes from the special report on the ocean and cryosphere by the Intergovernmental Panel on Climate Change (IPCC), where quantified analysis of adaptation is presented only as part of the “Maximum Potential Response” to sea level rise risks.
Such a response is “assuming minimal financial, social and political barriers”, yet investments of up to several hundreds of billions of US$ per year may face quite a range of barriers in reality. More “realistic” assessments of future adaptation need local and regional scenarios that incorporate information on barriers.
In our new study, published in Nature Sustainability, we propose a way to incorporate adaptation-relevant metrics into socioeconomic scenarios, and present a way of quantifying and projecting governance for individual countries as a key component for adaptive capacity.
Our findings reveal that the choice of socioeconomic pathway over the next few decades could mean the difference between 30% of countries still experiencing weak governance and weak governance being almost entirely overcome.
Adaptive capacity as a way to model adaptation
One of the reasons for underrepresentation of adaptation in modelling strategies might be that it is extremely complex to quantify.
Adaptation can occur autonomously, as a response to changing climatic conditions, or it can be planned and implemented as an anticipatory measure (pdf). It can be private or public, or interlinked. It can be sector-specific – and those sectors, such as water and agriculture, sometimes can overlap.
Even when adaptation is identifiable, its effectiveness is difficult to measure, rendering the development of comparable indicators of adaptation challenging.
One way to capture the intricacies of individual adaptation options and the local context is to analyse is the general conditions that enable or constrain adaptation in the first place.
This is where the concept of “adaptive capacity” comes in as particularly useful. This can be summarised as the ability of people, institutions and systems to respond to consequences of climate change.
The IPCC’s fifth assessment report (AR5) identified a set of constraints to adaptation that range from financial and economic, to human capacity, governance and socio-cultural factors. Removing these constraints is crucial for unlocking adaptive capacity.
The figure below shows how these constraints can be combined with the data available in the SSPs. Integrating these “dimensions” can represent a way forward for a representation of adaptive capacity.
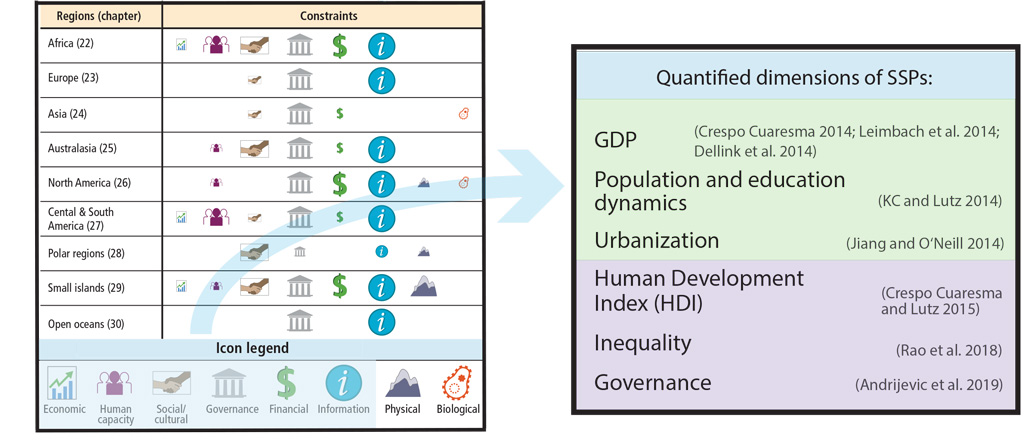
Schematic of constraints to adaptation (left box, adapted from Table 16-3 in AR5 Chapter 16, pdf) and existing quantified dimensions under the SSP framework. The shading indicates where the dimensions were released with the original SSPs (green) or added later (violet). Credit: Schleussner & Andrijevic
The importance of adaptive capacity is highlighted in the first paragraph of Article 7 of the Paris Agreement, which notes:
“Parties hereby establish the global goal on adaptation of enhancing adaptive capacity, strengthening resilience and reducing vulnerability to climate change, with a view to contributing to sustainable development and ensuring an adequate adaptation response in the context of the temperature goal referred to in Article 2.”
Governance is among the most pertinent constraints for adaptation, across both regions and sectors. There are numerous interventions that may enable or hinder adaptation – such as prioritising policies, mobilising resources, coordination of efforts, and decision making – are dependent on effective institutions.
Inept governance can hinder a country’s ability to realise adaptation goals and targets set according to the country’s level of vulnerability.
Corruption is particularly corrosive for governance since it damages public trust, diverts funds from budgets and even hinders the formation of human capital. It is no surprise that countries with better governance are more likely to receive adaptation aid from donors as it is assumed that the funding will be used more effectively.
An indicator for adaptive capacity over the 21st century
Understanding current and future evolution of governance is necessary for assessments of adaptive capacity and, thereby, the impacts of future climate change.
In our study, we aim to quantify the constraints to adaptation by creating a new indicator of governance from the data provided by the SSPs. The SSPs provide a set of five baseline scenarios that assess challenges to adaptation and mitigation based on the interplay of socioeconomic factors, such as income, population, education, urbanisation and inequality.
Our indicator is based on the well-established Worldwide Governance Indicators (WGI) that provide a composite index for governance with six subcategories: Voice and accountability, political stability, government effectiveness, regulatory quality, rule of law, and control of corruption.
To estimate and project our governance indicator, we developed an econometric model that quantifies the governance index using data provided in the SSPs. We draw on research that shows, for example, that economic and educational development are central determinants of improvements in the rule of law. Likewise, there is ample empirical evidence of a causal relationship between female representation in government and reduced levels of corruption, as well as a strong connection between gender empowerment and democracy.
The map below shows how we project governance to change over the 21st century. The main map shows how things stand in the present day. The governance indicator is normalised, so it ranges from a score of zero to one, with the higher score (shown by yellow and light green shading) indicating better governance. The charts overlying the map show projections for selected countries out to 2100.
The small maps then show our projections for governance under three of the SSPs out to 2050:
– SSP1 (“Sustainability – Taking the Green Road”): A rapid shift to sustainable development, increases in education and health investments, declining inequality both within and between countries and deep emphasis on economic growth and reduction of resource intensity in favour of improving environmental conditions.
– SSP2 (“Middle of the Road”): Characterised by uneven and sluggish economic growth and development with slower progress towards achieving the Sustainable Development Goals (SDGs).
– SSP3 (“Regional Rivalry – A Rocky Road”): An expectation of regional and global conflicts to result from international fragmentation and intercountry rivalry. Countries are preoccupied with national goals, which weakens international cooperation.
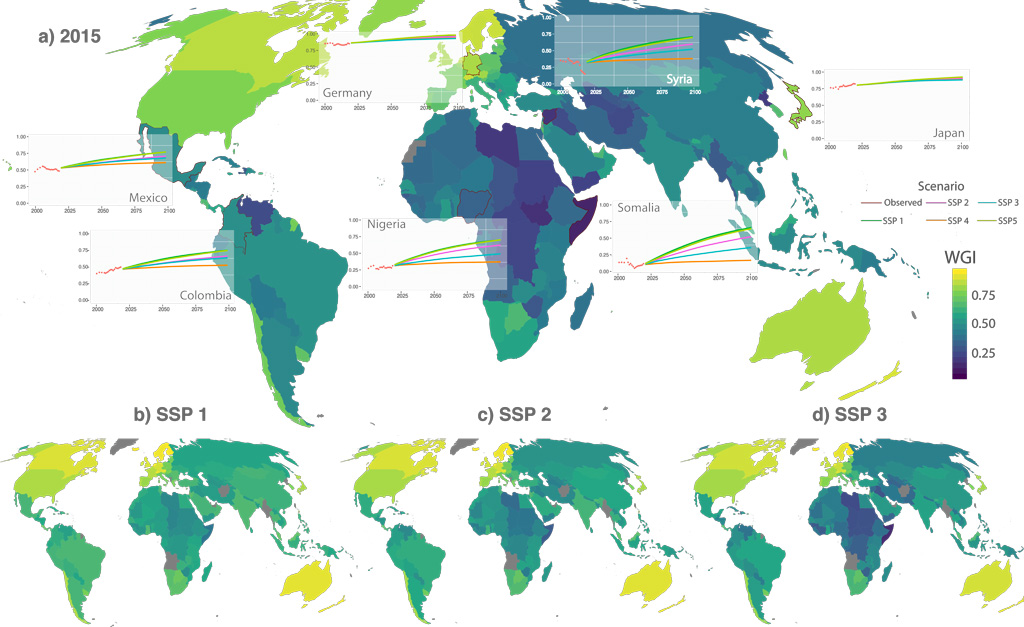
Maps show the evolution of governance over the twenty-first century. a) The values of the composite governance indicator for the world at present (in 2015). The indicator has been normalised to a range from zero to one, with higher values – indicating better governance – indicated by yellow and light green shading, and low values shown by dark blue shading. The maps below show the global distribution of future governance in 2050 for different SSPs: b) a “sustainable future” (SSP1); c) a “middle-of-the-road” scenario (SSP2); and d) a “rocky road” characterised by unequal development and regional rivalry (SSP3). The main map also shows the scenario-dependent evolution of governance for selected countries over the twenty-first century. Source: Andrijevic et al. (2019)
Under rapid development, such as in SSP1, only a small number of countries are projected to have very weak or weak governance – defined as the state of a country below the median of the governance indicator today – and almost all countries may reach states of good governance by the end of the century.
In contrast, under the “rocky road” SSP3, little improvement in governance is projected globally over the twenty-first century.
Indeed, under SSP3, countries that are home to around three billion people in 2050 – or five billion by 2100 – will continue to be characterised by weak governance. Even under the “middle-of-the-road” SSP2 scenario, about 1.5 billion people will be living in about 40 countries with weak governance by mid-century.
We also find that countries characterised by very weak governance, albeit starting from a low level, have an up to five times higher rate of improvement in scenarios of rapid socio-economic development under SSP1 compared to SSP3.
For developed countries, such as Germany or Japan, whether the country follows the most- or the least-progressive scenario makes only a minor difference for future governance, since their scores remain very high in all scenarios.
Yet, for less-well-off countries, the path of socioeconomic development is decisive for how governance is expected to evolve. For countries such as Somalia or Nigeria, the difference between following SSP1 and SSP3 could result in anything from stagnation to trifold improvement.
With our extension for governance, the socioeconomic indicators from the SSP framework can be a useful toolkit for developing indicators of adaptation capacity. For a holistic picture, the changes of adaptive capacity should be compared with the emergence of climate signals, because their co-evolution will ultimately determine the extent of climate change impacts.
The evolution of adaptive capacity and its relevance for loss and damage
The recent IPCC special report on global warming of 1.5C underscored the substantial differences in climate impacts between 1.5C and 2C that could materialise even before the middle of the century.
While vulnerable countries will be striving for sustainable development and improving their adaptive capacity, climate impacts will continue to intensify. As our results show, improvements of governance will take on average at least three decades even under scenarios of rapid and sustainable development.
This indicates that limits to improvements in adaptive capacity may persist during the 21st century, leading to elevated risks and impacts of climate change in countries with low socioeconomic development.
Such a perspective on limits to adaptive capacity links to the discussion on “loss and damage” – the economic and non-economic adverse effects of climate change that go beyond what can be prevented by adaptation.
Our study establishes that there is a time-dependent upper limit to what can be expected for countries in terms of increasing their adaptive capacity to climate change.
Since adverse impacts of climate change will further impede the pace of sustainable development and the strengthening of adaptive capacity, adequate responses and support schemes for loss and damage will be crucial policy instruments to help vulnerable countries to cope with the impacts of climate change.
Similar to how it is taken for granted that big emitters cannot fully decarbonise overnight, increasing the adaptive capacity of the most vulnerable will equally take decades.
And over that period, support will be needed to help the vulnerable countries cope with the residual risks and impacts of climate change – a strong argument for advancing the discussions on tangible responses to loss and damage.
The post Guest post: Why climate scenarios need to better incorporate ‘adaptive capacity’ appeared first on Carbon Brief.


