

The world’s water supply has been severely altered by global warming and changes to land use – such as agriculture and damming – over the past 15 years, new satellite data shows.
The Nature study of 32 world regions finds that the largest freshwater losses are occurring across the Middle East, India, Antarctica and Greenland. In contrast, the largest gains are taking place in parts of Asia, North America and South America.
From 2002 to 2016, Greenland lost an average of 279m tonnes of freshwater a year – which is almost 10 times the amount of the water stored in Lake Mead, the world’s largest manmade reservoir. The reservoir was formed between Nevada and Arizona by the construction in the 1930s of the Hoover Dam.
The findings show that there is now a “clear human fingerprint” on the global water supply, the researchers say. However, natural variability also played a role in driving changes to water availability over the study period, they add.
Grace period
Rising temperatures can threaten water security by boosting evaporation, changing rainfall patterns and causing snow to fall increasingly as rain. Warming can also affect water supplies by causing glaciers and ice sheets to melt. In Asia alone, 800 million people rely on glaciers for freshwater.
The new research draws on data captured by NASA’s Gravity Recovery and Climate Experiment (GRACE) Mission, a set of two identical Earth-mapping spacecraft that fly 500km above the planet.

Satellite maintenance in preparation the Gravity Recovery and Climate Experiment Follow-on (GRACE-FO) mission, a successor to the original GRACE mission, which began orbiting Earth on 17 March 2002. Credit: Mathias Pikelj / NASA.
The researchers identified 34 regions that have experienced large increases or decreases in freshwater availability. They then set out to determine whether climate change, land-use change or natural variability could have impacted water storage.
For the role of land-use change, the researchers compared their results to previous data on the global distribution of activities, such as agriculture and mining.
These activities can contribute to water insecurity by driving the overdraining of groundwater stores – which occurs when water is pumped out of the ground faster than it can be replaced by natural processes.
To assess the influence of climate change and natural variability, the researchers analysed the available scientific literature on climate change attribution for each region.
Global view
The map below shows the 34 regions with the largest changes to water storage from 2002-2015. On the map, dark red shading shows water storage loss while dark blue shows water storage gain.
The coloured lines show whether the region experienced a probable climate change impact (red), a possible climate change impact (purple), a probable direct human impact (orange), a possible or partial direct human impact (yellow) or probable natural variability (green).
The effect of climate change was defined as “probable” if previous studies had found a definitive link between global warming and changes to the water supply in the region and “possible” if only a correlation was found.
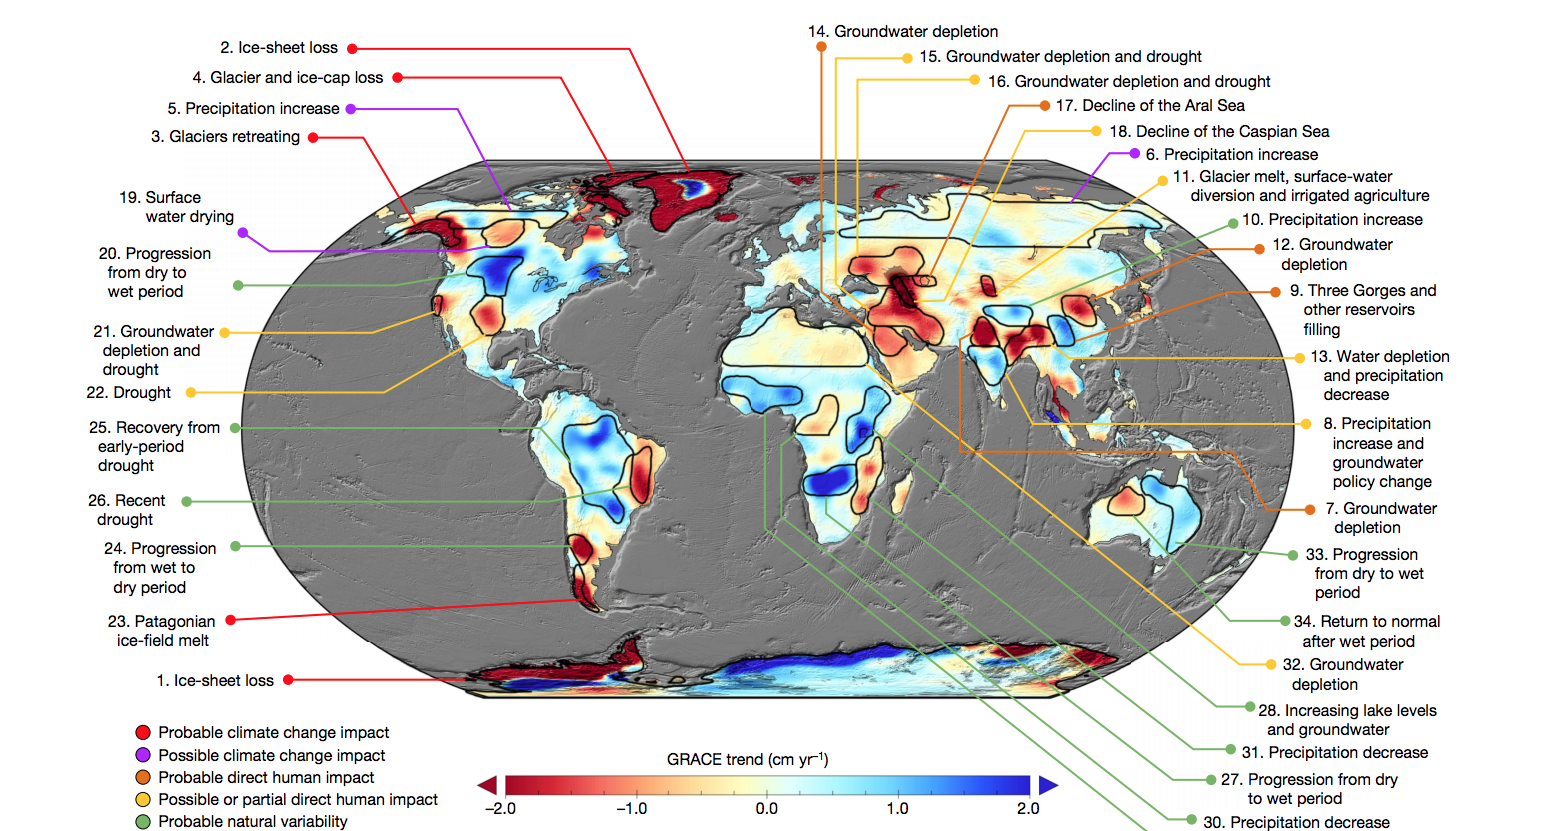
Changes in terrestrial water storage from 2002-16. Shading indicates water storage increases (blue) and decreases (red). The key shows whether the region felt a probable climate change impact (red), a possible climate change impact (purple), a probable direct human impact (orange), a possible or partial direct human impact (yellow) or probable natural variability (green). A brief description of the causes of change in each study region is given. Source: Rodell et al. (2018)
The results show that, across the world, most water storage losses appeared to be driven by climate change and other human activity, while most gains were the result of natural variability, says lead author Dr Matthew Rodell, chief of the Hydrological Sciences Laboratory at the NASA Goddard Space Flight Center. He tells Carbon Brief:
“[We] quantify and explain 34 prominent trends in freshwater storage around the world. Of those, eight were associated with climate change and 14 were associated with human activities like groundwater pumping. Only 12 were caused by natural variability alone.”
Falling water
The largest storage losses occurred in Antarctica (region one on the map), Greenland (region two), the Gulf of Alaska (region three) and the Canadian archipelago (region four). These losses were driven by rapid ice sheet and glacier melt as a result of climate change, the researchers say.
However, northern India (region seven) was also a hotspot for water loss over the study period, the researchers say. The loss likely resulted from the over extraction of groundwater to irrigate crops, such as wheat and rice, in the region – which has a semi-arid climate.
Parts of the Middle East (regions 14-15), including Saudi Arabia, Iran, Iraq and Syria also experienced declines in water availability. The declines likely result from recent droughts and, therefore, increases in groundwater demand, the researchers say.
In the US, the biggest losses occurred in California (region 21), including in the Central Valley, which provides one-third of the vegetables and two-thirds of the fruit and nuts grown in the US, and in southern California, which has faced increased groundwater demand as a result of recent severe droughts.
At the very south of South America, freshwater losses occurred as a result of the melting of the Patagonian ice fields (region 23), which is is being driven by climate change, the researchers say.
Wet spots
The findings also suggest that freshwater supplies in some regions have grown larger in the past 15 years.
![]()
El Niño: Every five years or so, a change in the winds causes a shift to warmer than normal sea surface temperatures in the equatorial Pacific Ocean – known as El Niño. Together with its cooler counterpart, La Niña, this is known as the El Niño Southern Oscillation (ENSO) and is responsible for most of the fluctuations in temperature and rainfall patterns we see from one year to the next.
Some of the largest gains took place in parts of North America (region number five on the map) and Eurasia (region six). The increase was likely driven by rainfall increases, the research says, which may have been influenced by climate change.
The link between rainfall increases and climate change will likely become clearer over the next decade or so, says Rodell:
“It will take at least another 15 years to attribute the apparent trend to climate change with any certainty. More flooding is a possibility, but these are sparsely populated regions for the most part.”
In other parts of the world, including areas of Brazil and southern Africa, water storage increases were driven by natural – and largely temporary – oscillations between wet and dry seasons, he adds:
“When precipitation is above normal for an extended period of time in a particular region, that region’s aquifers, soils, and surface waters are replenished. The reverse is also true.
“In a 14-year record, if you have a wet period in the beginning and a dry period at the end, it will look like a negative trend – for example in eastern Brazil – and a dry period followed by a wet period will look like a positive trend, for example in eastern Australia.”
One phenomenon that is likely to have played a large role in natural climate fluctuations is El Niño, says Prof Kevin Trenberth, a senior scientist at the National Center for Atmospheric Research (NCAR) in Colorado, who was not involved with the research. He tells Carbon Brief:
“The biggest source of variability is the El Niño phenomenon. Typically during an El Niño event the ocean is especially warm over the Pacific and the rains tend to preferentially occur there, including hurricanes and typhoons. In 2011 to 2012, there was major flooding in many places: especially Australia – where Lake Eyre filled up – and also in upper Mississippi and parts of Siberia.”
Human fingerprint
While natural variability accounted for some changes to water storage over the past 15 years, it is clear that humans have altered the global water supply, the researchers say in their paper:
“A…characteristic of the map is that it reveals a clear ‘human fingerprint’ on the global water cycle.”
Continued monitoring of these changes will be vital for conserving water and protecting against water crises, such as droughts and floods, says Rodell:
“The main message is that freshwater availability is changing around the world due to both climate change and direct human impacts, and it is imperative that we continue to monitor it carefully so that decision-makers can enact the appropriate policies for conserving water resources and preventing future catastrophes.”
The post Mapped: How global warming and land-use change threaten water security worldwide appeared first on Carbon Brief.


