
Since 2000, the world has doubled its coal-fired power capacity to 2,000 gigawatts (GW) after explosive growth in China and India. Another 200GW is being built and 450GW is planned.
More recently, 200GW has closed due to a wave of retirements across the EU and US. Another 170GW is set to retire by 2030 and 13 of the world’s 77 coal-powered countries plan a total phaseout.
Meanwhile, electricity generated from coal peaked in 2014, so the expanding fleet is running fewer hours than ever. This erodes coal’s bottom line, as does competition from gas and renewables.
The way coal’s next chapter unfolds is key to tackling climate change. All unabated coal must close within a few decades if warming is to be limited to less than 2C above pre-industrial temperatures, according to the International Energy Agency (IEA).
To shed light on this story, Carbon Brief has mapped the past, present and future of all the world’s coal-fired power stations. The interactive timeline map, above, shows the plants operating in each year between 2000 and 2017, as well as the location of planned new capacity.
Using data from CoalSwarm’s Global Coal Plant Tracker, it features around 10,000 retired, operating and planned coal units, totalling nearly 3,000 gigawatts (GW) across 95 countries.
- How to read the timeline map
- Rising coal capacity
- Slowing coal growth
- Peak CO2 emissions
- Eroding coal economics
- Key countries and regions
How to read the timeline map
The timeline map above shows a circle for each coal plant in the world, proportional to the generating capacity in megawatts (MW). Each plant may be made up of multiple units – the individual boilers and steam turbines. The notes at the end of this article explain how the data was processed.
The graphic, below, explains how to use the map features. Select the year, region and base map – including a satellite view – using the information box on the left.
Zoom, rotate and tilt the map using the navigation tools in the top right corner and your mouse scroll wheel. Use the search box to find locations by city, region, postal or zip code. The home button will reset the map to its original state.
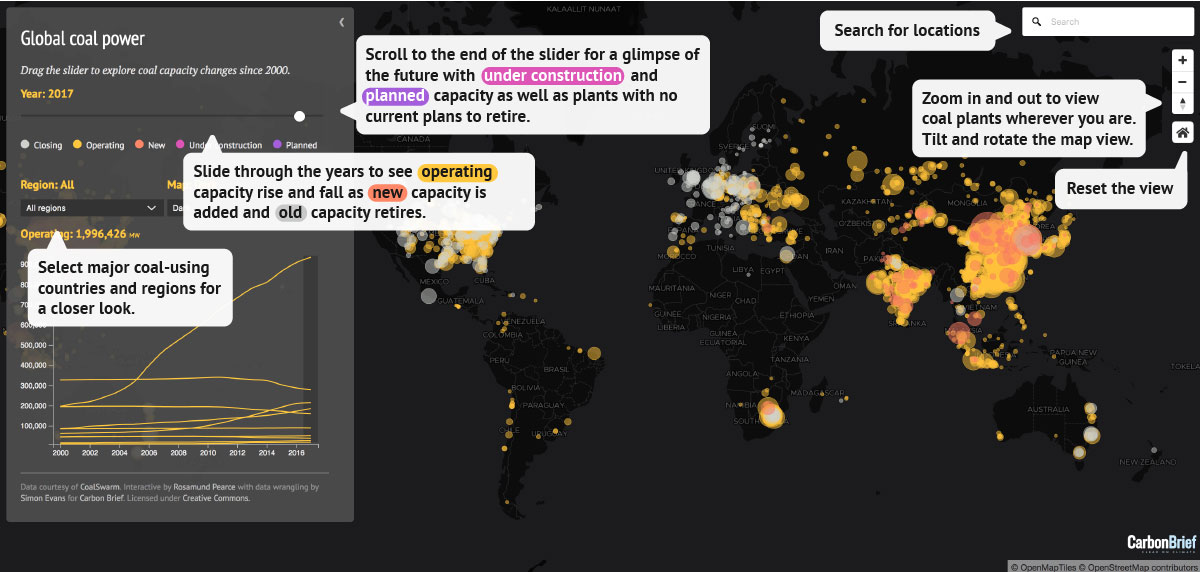
Coal plants on the map are colour-coded according to whether they are operating (yellow), new or expanded that year (red) and closing or shrinking the following year (white).
Drag the timeline slider from 2000 through to 2017 to see where and when coal plants are added and retired. For 2017, plants are coloured white if they are expected to close some or all of their units.
The rightmost end of the slider (“Future”) shows plants that have no known plans to retire (yellow), those currently being built (pink) and those in various stages of planning (purple).
Note that since 2010, only 34% of planned capacity has been built or started construction (873GW), whereas 1,700GW has been cancelled or shelved, according to CoalSwarm. For example, a tender to build one new plant may attract several bids, all of which would be counted towards the “planned” total.
![]()
Load factor: A measure of the average output of a power station, relative to its installed capacity. This depends on technical and economic factors. For individual gas, coal or nuclear plants the load factor can in theory be above 90%. However, UK fleet-wide averages are much lower. The range of fleet-wide average load factors during 2010-2014 was 28-62% for gas, 40-57% for coal and 65-74% for nuclear. The range of rates for the UK’s renewable fleets was 10-11% for solar, 22-28% for onshore and 30-38% for offshore wind. Newer windfarms tend to have larger turbines, particularly offshore, and are expected to reach load factors of up to 48%.
The map shows coal capacity, whereas electricity generation and CO2 emissions depend on a range of other factors. Most important is how often coal plants run – their load factor. Global average loads started falling in 2007 and coal power CO2 peaked in 2014. More on this below.
Finally, note that the map design is responsive and has fewer features on smaller mobile devices. The map uses WebGL and will not work on some older browsers. The map may also fail to load if you are using an ad-blocking browser plugin; try whitelisting the Carbon Brief website.
Rising coal capacity
Global coal capacity grew in every year between 2000 and 2017, nearly doubling from 1,063GW to 1,995GW. As far back as 1950, coal capacity has only ever risen – though this older data is less reliable.
The promise of cheap electricity to fuel economic growth is driving this expansion. Coal generates 40-41% of the world’s electricity, its highest share in decades. And there are now 77 countries using coal power, up from 65 in 2000. Another 13 plan to join the club.
CO2 emissions from existing plants are enough to breach the carbon budget for 1.5 or 2C. These limits would mean no new coal plants and closing 20% of the fleet early, according to one recent study.
All unabated coal would have to close by 2040 to stay “well below” 2C, according to the International Energy Agency (IEA). This would mean closing 100GW of coal capacity every year for 20 years, or roughly one coal unit every day until 2040. (Some pathways have slightly slower phaseouts.)
Yet newspaper headlines and energy projections suggest coal growth will not stop.
This bleak outlook for the climate is tempered by signs of rapid change. The pipeline of plants under construction (pink) or proposed (purple) has halved since 2015, as the chart below shows. Retirements (grey) are also accelerating, reaching a cumulative 197GW between 2010 and 2017.
Global coal power capacity operating in 2010 through 2017 (yellow) as well as cumulative retirements (red) and capacity being built (purple) or planned (grey). Sources: Global Coal Plant Tracker 2014-2018; World Resources Institute Global Coal Risk Assessment 2012. Plans for 2010, 2011 and 2013 are interpolated from other years. Chart by Carbon Brief using Highcharts.
As with global CO2 emissions, coal capacity has to peak before it can start to fall.
Slowing coal growth
The IEA says global coal investment has already peaked and is now in a “dramatic slowdown”. It says that China, which is building much of the current pipeline, has no need for new plants.
This fall in investment means coal capacity growth is slowing, as the chart below left shows. In 2011, global coal capacity increased by 82GW. This figure was 60% lower in 2017, at 34GW.
Left: Coal power capacity additions and retirements (gigawatts) between 2000 and 2017 (coloured columns) and the global net change (black line). Right: The number of coal units added and retired by country (coloured columns) and the global net change (black line). Source: Global Coal Plant Tracker and Carbon Brief analysis. Chart by Carbon Brief using Highcharts.
The number of plants newly under constructed each year is falling even faster, down 73% since 2015, according to the latest annual status report from CoalSwarm, Greenpeace and the Sierra Club. Meanwhile, coal retirements are at historically unprecedented levels, though the pace has slowed since 2015.
All this means that global coal power capacity could peak as soon as 2022, the status report says.
Intriguingly, the number of coal units in the world could already have peaked, as the chart above right shows. In 2017, the number of units increased by just six, down from a net of 273 in 2006. The chart shows how several countries, notably China, have been closing many hundreds of smaller, older and less efficient units, replacing them with larger and more efficient models.
Peak coal CO2 emissions
Data from the IEA shows CO2 emissions from coal power may also have peaked already, in 2014, even though coal capacity continues to increase. Coal CO2 emissions fell 3.9% between 2014 and 2016 (red line) and coal generation by 4.3% (yellow), as the chart below shows.
Since coal capacity continues to increase (pink), existing coal plants are running for fewer hours (purple). On average, the world’s coal plants were running around half the time in 2016, with a load factor of 52.5%. The trend is similar in the US (52%), EU (46%), China (49%) and India (60%).
Left axis: Global coal-fired electricity generation (yellow, terawatt hours), CO2 emissions (red, millions of tonnes of CO2) and capacity (pink, megawatts) between 2000 and 2016. Right axis: Average load factors for the global coal fleet (purple, %). Source: IEA World Energy Outlooks and Carbon Brief analysis. Unlike the rest of this article, the IEA data includes small coal plants of less than 30MW. Chart by Carbon Brief using Highcharts.
Apart from running hours, a range of other factors affect the relationship between coal capacity and CO2 emissions. These include the type of coal and combustion technology each plant uses.
Plants burning low-quality lignite can emit as much as 1,200 tonnes of CO2 per gigawatt hour (GWh) of electricity generated, falling below 1,000tCO2/GWh for harder, less polluting grades from sub-bituminous through to bituminous coal. (Rarely used anthracite is hard, but has high CO2 emissions, as it contains less hydrogen than other grades.)
The combustion technology is also important, from less efficient “subcritical” units through to super- and ultra-supercritical systems, which raise efficiency by running the boiler at higher pressures.
The oldest and least efficient subcritical units might turn less than 35% of the energy in coal into electricity. Newer subcritical plants raise this towards 40% and ultra-supercritical units to 45%.
Parts of the coal industry refer to ultra-supercritical units as “high efficiency low emissions” (HELE).
However, even HELE coal plants emit around 800tCO2/GWh, according to the World Coal Association. This is roughly twice the emissions of gas-fired electricity and in the order of 50-100 higher than nuclear, wind or solar. The IEA sees little role for coal-fired power in 2C scenarios as residual emissions are too high, even when using carbon capture and storage (CCS).
Note that the chart, above, contains the latest available information from the IEA. There was a slight uptick in coal generation and CO2 emissions in 2017, driven by increases in China, though they remain below the 2014 peak. See below for more on coal’s status in key countries.
Eroding coal economics
Low load factors are corrosive for coal-plant economics. In general, plants are designed to run at least 80% of the time because they have relatively high fixed costs. This is also the basis of cost estimates for building new coal, whereas lower running hours raise costs per unit of electricity.
This dynamic is particularly toxic for coal-plant operators competing against the rapidly falling costs of renewables, cheap gas in the US and rising carbon prices in the EU. Constraints on coal supply are raising coal prices, further undermining any remaining cost advantage over the alternatives.
New solar is now cheaper than new coal in India.
And solar is closing the gap fast in other Asian countries, from China to Thailand to Vietnam.https://t.co/8quLDCPruy pic.twitter.com/EQuk2TZcXi
— Simon Evans (@DrSimEvans) May 24, 2018
New air pollution rules are also increasing coal-plant costs in many jurisdictions, from the EU to India to Indonesia. Operators must invest in pollution control equipment to meet higher emissions standards, or close their dirtiest plants altogether.
This combination of factors means large parts of the existing coal fleet in the EU and even in India face severe economic headwinds under prevailing market conditions, according to financial thinktank Carbon Tracker. It has found that nearly all EU plants would be loss-making by 2030, for example.
Similarly Bloomberg New Energy Finance founder Michael Liebreich says coal faces two “tipping points”. The first is when new renewable energy is cheaper than new coal, which has already happened in several regions. The second is when new renewables are cheaper than existing coal.
Note that coal plants may remain open in the face of unfavourable economic conditions for other reasons, for example, due to capacity market payments.
Key countries and regions
Some 77 countries use coal to generate electricity, up from 65 in 2000. Since then, 13 countries have added coal capacity for the first time and one country – Belgium – has phased it out.
Another 13 countries – responsible for 3% of current capacity – have pledged to phase out coal by 2030 as part of the “Powering Past Coal Alliance”, led by the UK and Canada. Meanwhile, 13 countries hope to join the coal power club in future.
A few key countries dominate this picture. The world’s top 10 nations for coal capacity, shown on the left-hand side of the table below, account for 86% of the total operating today and 64% of plants in the pipeline. The right of the table shows the top 10 nations for planned capacity.
| Country | Operating (MW) | Share | Country | Pipeline (MW) | Share |
|---|---|---|---|---|---|
| China | 935,472 | 47% | China | 210,903 | 32% |
| United States | 278,823 | 14% | India | 131,359 | 20% |
| India | 214,910 | 11% | Vietnam | 46,425 | 7% |
| Germany | 50,400 | 3% | Turkey | 42,890 | 7% |
| Russia | 48,690 | 2% | Indonesia | 34,405 | 5% |
| Japan | 44,578 | 2% | Bangladesh | 21,998 | 3% |
| South Africa | 41,307 | 2% | Japan | 18,575 | 3% |
| South Korea | 37,973 | 2% | Egypt | 14,640 | 2% |
| Poland | 29,401 | 1% | Pakistan | 12,385 | 2% |
| Indonesia | 28,584 | 1/5 | Philippines | 12,141 | 2% |
China has the largest coal fleet by far and is also home to the world’s heaviest concentration of coal plants, with 97GW in a 250km radius along the Yangtze River delta around Shanghai. This is more capacity than all except three countries (China, India and the US), as the table above shows.
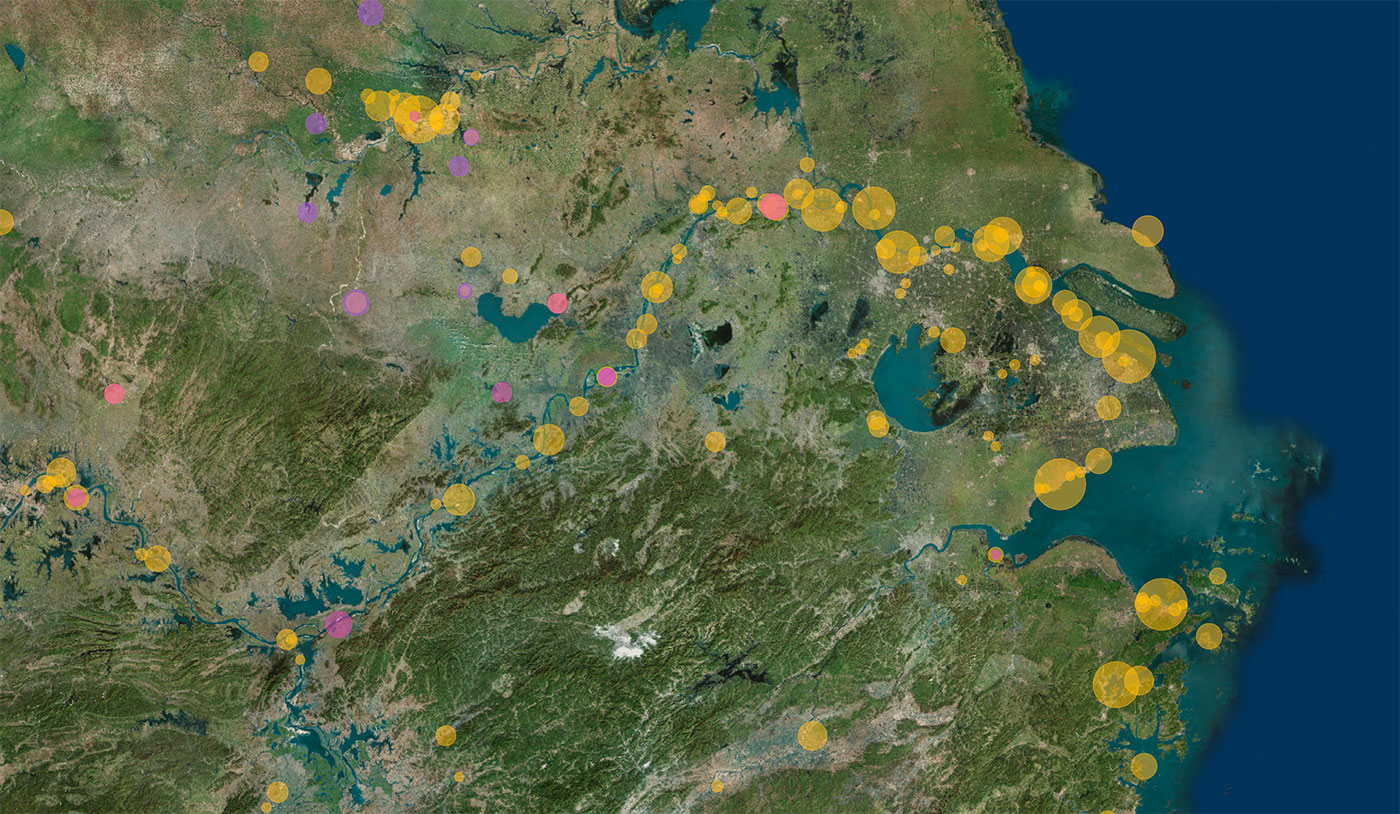
China
Since 2000, the most dramatic changes have taken place in China, as the slider below shows. Its coal fleet grew five-fold between 2000 and 2017 to reach 935GW, nearly half the global total.
China is the world’s largest CO2 emitter and uses half the coal consumed each year, so its future path is disproportionately important for global efforts to tackle climate change.
Industrial activity and coal use are being spurred by stimulus spending prior to President Xi’s appointment as “leader for life”. This could push CO2 emissions growth to its fastest rate for years, depending how long it continues. Yet some analysts say China’s coal use could halve by 2030.
The government is enacting a national carbon trading scheme as well as waves of cancellations and restrictions on new coal power, in response to air pollution and climate concerns. This means its pipeline of plants being built or planned has shrunk 70% since 2016, according to CoalSwarm.
It also means planned projects are unlikely to get the permits they need to get built, says Lauri Myllyvirta, energy analyst at Greenpeace East Asia. He tells Carbon Brief:
“A lot of the planned projects in China and India are effectively dead in the water. In India, they are commercially dead, no one in their right mind is going to build them…In China, economically, it makes no sense as they already have way too much capacity.”
Coal-fired capacity and generation in China has more or less peaked, according to the US Energy Information Administration (EIA).
India
The second-largest increase in capacity since 2000 has been in India, where the coal fleet has more than tripled to 215GW. This expansion can be seen in the slider, below.
More recently, Indian coal fortunes have fast been turning sour. The IEA dramatically cut its latest forecast for Indian coal demand, due to slower electricity demand growth and cheaper renewables.
Some 10GW of existing coal is “unviable” and another 30GW “stressed”, according to India’s power secretary, interviewed by Bloomberg Quint in May 2018. This is because “India’s renewables revolution is pushing coal off the debt cliff,” writes Matthew Gray, senior analyst for Carbon Tracker.
India’s latest National Electricity Plan targets 48GW of coal retirements, in part due to new air pollution rules. It also foresees 94GW of new coal capacity, a target analysts find more doubtful. The country has 44GW under construction, of which 17GW has been on hold for years.
“For India, it’s a very clear case where renewables are able to deliver power at lower cost than new coal and even a lot of existing capacity,” says Myllyvirta.
US
A wave of retirements has cut US coal capacity by 61GW in six years and another 58GW is set to close, says CoalSwarm. This would shrink the US fleet by two-fifths, from 327GW in 2000 to 220GW in future, as the slider below shows.
One wildcard is the Trump administration’s reported plans to bailout unprofitable coal plants on national security grounds, in a move described by Bloomberg as “an unprecedented intervention into US energy markets”. This follows earlier, abandoned efforts in the name of “grid resilience”.
Market conditions, on the other hand, currently favour gas-fired power plants and renewables. There are no plans for new US coal capacity. Retirements in 2018 are expected to top 18GW, second only to 2015. Last year, US power sector coal consumption was the lowest since 1982.
See Carbon Brief’s earlier map of all the power plants in the US for more.
EU
The EU is also seeing a wave of coal retirements. Given member state plans to phase out coal, the bloc’s fleet is set to fall below 100GW, barely half its capacity in 2000, as the slider below shows.
Along with Canada, EU countries are leading global efforts to phase out coal. The UK, France, Italy, Netherlands, Portugal, Austria, Ireland, Denmark, Sweden and Finland have all pledged a phaseout before 2030. Their coal fleets total 42GW, including several recently built plants.
Nevertheless, the world’s fourth and ninth largest national coal fleets are in EU member states, namely, Germany’s 50GW and Poland’s 29GW.
A commission on setting a phaseout date for Germany is off to a rocky start, though the country’s grid regulator says half the coal fleet could close by 2030 without compromising security of supply. Poland says it will not build new coal beyond what is already under construction.
Research last year suggested all EU coal plants should close by 2030, in order to meet the goals of the Paris Agreement. Rising carbon prices are expected to drive coal-to-gas switching this year, subject to the price and availability of gas.
Other key countries
Other Asian countries, including South Korea, Japan, Vietnam, Indonesia, Bangladesh, Pakistan and the Philippines, have collectively doubled their coal fleet since 2000, reaching 185GW in 2017.
Together, these countries are building 50GW of new plants and have another 128GW planned, with many of the projects in poorer nations being financed or built by China, Japan and South Korea.
Campaigners see a fast-developing Asia as the key risk for coal expansion. Myllyvirta tells Carbon Brief:
“China and India still matter a lot, but, megawatt for megawatt, I would put a lot more weight on other parts of Asia.”
There are mixed signs for coal in many of these countries. For example, Japan’s latest draft national energy plan sees a significant role for coal in 2030, whereas the Paris Agreement means it should mostly phase out coal by then, according to Climate Analytics, a scientific NGO.
Major plans for new coal capacity are opposed by communitiess, NGOs and some newspapers. Nearly a quarter of the new plants planned by the end of 2017 have been cancelled or shelved this year.
Vietnam has the world’s third-largest plans for new coal, totalling 46GW, of which 11GW is already being built. “Yet the government is increasingly invested in changing this trajectory,” writes Alex Perera, deputy director of energy at thinktank the World Resources Institute. He continues:
“Vietnam provides an interesting and important combination of conditions that can enable a meaningful transition to clean energy: government commitments to renewables and a private sector eager to meet increasingly stringent clean energy targets.”
In Indonesia, the government will not approve new coal plants on its most heavily populated island of Java. The state-owned utility has been criticised for “massively overestimating likely [electricity] demand growth” to justify plans for new coal.
Turkey also has significant plans to expand its coal fleet (see the recent Carbon Brief profile of Turkey’s climate and energy policy). Notably, however, only 1GW of a total pipeline of 43GW of new coal is currently under construction.
Another country with major plans is Egypt, which has no coal plants and no domestic coal deposits. Note that none of the 15GW of planned capacity has moved beyond the earliest phases of development, with none entering the permitting process, none yet permitted and none being built.
South Africa has large coal deposits and the world’s seventh-largest coal power fleet. It is building 6GW of new coal with plans for 6GW more. The political mood is shifting since Cyril Ramaphosa’s election earlier this year, however, and long-delayed renewable deals worth $4.7bn were signed in April.
Unusually, South African heavy industry favours renewables over continued coal growth. New coal would be much more expensive than the alternatives, separate research suggests. A legal wrangle looms over coal’s role in South Africa’s new electricity investment plan, due later this summer.
Methodology
Carbon Brief’s timeline map is based on the Global Coal Plant Tracker, compiled by CoalSwarm. The current map uses data from February 2018. This database includes all coal units of 30MW capacity or larger, covering operating and retired plants as well as those proposed since 2010. (As noted above, there are thought to be roughly 27GW of smaller coal plants.)
This covers a total of 4,567GW of capacity, of which 1,996GW is operating today (1,995GW as of the end of 2017), 210GW is under construction, 443GW is planned, 2,387GW is retired and 1,681GW has been proposed, but then cancelled since 2010.
Carbon Brief made a number of assumptions to compile the map, explained below.
As of 9 April 2018, 27 countries have joined the Powering Past Coal Alliance on phasing out coal power, of which 13 still have operating plants. The map assumes each of these countries will complete its phaseout by the pledged year.
Coal units – the individual boilers listed in the database – are grouped together using the listed “Plant” name. However, some sites have two or more plants with subtly different names, such as “Plant-1”, “Plant-2”. These plants are grouped again in a second automated step based on their latitude. In these cases, only the first name (Plant-1) is retained for the map.
Some grouped plants have units using different combustion technologies, such as subcritical and supercritical boilers. During the data grouping step, some of these differences will have been lost. For grouped plants, the map shows the range years when units started operating.
Plants in the pipeline are a mixture of sites under construction, already permitted, pre-permit and at an early stage of planning (“announced”). Some sites host projects at different stages of this process, which would be semi-hidden on the map since their locations are the same. A random offset on the order of ±50m is applied to the location of all units in the pipeline, so as to artificially separate them on the map.
The map omits 15 units in the database lacking information on capacity, as well as eight operating or retired units, totalling 0.4GW, that lack location data.
There are 105 retired units (6.2GW) and 129 operating units (8.2GW) without a listed “Start Year”. The map assumes these units have been operating since 2000 onwards.
Some 105 retired units (7.9GW) lack a “Retire Year”, most of which are in China. These plants are assigned a random retirement year between 2000 and 2017, using years weighted according to the distribution of known retirements in China and the rest of the world, respectively.
The post Mapped: The world’s coal power plants appeared first on Carbon Brief.


