

Posted on 23 May 2017 by Evan
Tag Line
We age linearly and earn non-linearly.
In a warming world, coastal flooding occurs non-linearly … or faster!
Elevator Statement
Linear means a straight line, non-linear means a line that is not straight, and is often a simple, curved line. Consider the following examples from our everyday lives that illustrate linear and non-linear behavior.
- Our age increases linearly, because our age increases at a constant rate, 1 year per year.
- Our income increases non-linearly, because our income increases at a varying rate, x% per year.
When the change of your salary is related to your salary, you get a non-linear response. To illustrate, suppose you got a 3.5% raise each year.
- Year 1: Start with a $30,000/year salary.
- Year 2: 3.5% more than $30,000. New salary is $30,000 + 0.035*30,000 = 31,050.
- Year 3: 3.5% more than $31,050. New salary is $31,050 + 0.035*31,050 = 32,137.
- …
Suppose a person is born in the year 2000. If we do the simple thing and plot their age on the “Y” axis and the year on the “X” axis, we get a straight line, as follows. We call this a linear relationship. If they start working at age 16, for $30,000/year, and if they get a pay raise of 3.5%/year until they retire at age 65, then we get the non-linear growth of income.
Climate Science
Researchers like James Hansen regularly talk about the doubling time for ice melt, especially in his recent paper “Ice melt, sea level rise and superstorms: evidence from paleoclimate data, climate modeling, and modern observations that 2°C warming could be dangerous,” published by Hansen and 18 co-authors. What do they mean when they say “doubling time?” In their paper they talk about 10-, 20-, or 40-year doubling times that could yield multi-meter sea level rise in 50, 100, or 200 years. What does all of this mean? In a nut-shell, doubling times are techno-speak for non-linear relationships. We can break down doubling times in terms of annual percentage increases as follows, similar to the annual 3.5% salary increase of our young worker.
| Annual Increase [%] | Doubling Time [years] |
| 1.8 | 40 |
| 2.3 | 30 (within the IPCC 5th-assessment projections) |
| 3.5 | 20 |
| 5.0 | 14 |
| 7.0 | 10 |
Let’s work out what all of this means for our young worker who has their first job, and in the not too distant future may be considering buying property on the East Coast of the USA.
Sea level is currently rising at about 3 mm/year. Starting with this rate, we work out how fast sea level rises for the following annual rates of increase: 0, 2.3, 3.5, 5.0, and 7.0%. Note that a 0% annual increase implies a linear rate of increase of sea level: sea level will be assumed to rise at a constant rate of 3 mm/yr into the future. The non-zero rates imply non-linear rates of increase as shown in the following plot.
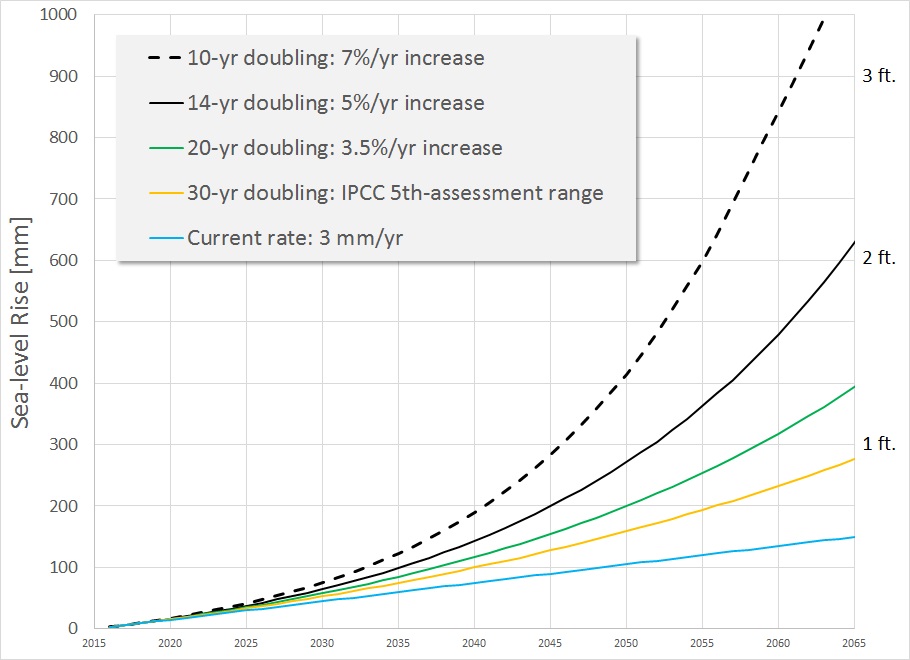
Note that making sea-level predictions is much more complicated that using this simple plot, because sea-level responds not only to melting ice, but also to the warming oceans (causing the water to expand, much like in an old-fashioned mercury thermometer) and to local changes in land elevation due to other natural processes. What this plot allows one to do, however, is to convert from techno-speak of ??-year doubling times to what that means in terms of sea-level rise over a specific time period.
So what does all of this mean for someone who buys a house near the East Coast of the USA, and is concerned about the future of their property? Because some East-coast states have been reluctant to embrace even the conservative IPCC forecasts, much less the more current results from researchers like James Hansen and others, our coastal homeowner to-be does their own research and uses the above plot to determine a “safe” place to buy a house, consistent with their risk tolerance. The 14-year doubling time is included because Hansen et al. note that “Recent ice melt doubling times are near the lower end of the 10-40 year range”, and a 14-year doubling time works out to an annual rate of increase of 5%, which is a nice, round number. So whereas 10-yr. doubling times can be viewed as a worst-case scenario, the 14-yr. doubling time is one for which there is some basis from current observations, although the data set from which Hansen et al. draw their conclusions is too short to be definitive. However, considering that we buy insurance to cover improbable events, when current research suggests a probable event such as coastal flooding, it is only prudent to plan accordingly. The scenario we accept from this graph depends on how averse we are to risk. Perhaps the important question to ask is not what risk scenarios our individual home owners are selecting for themselves, but rather, what risk scenarios are East-coast legislators imposing on their constituents?
Because coastal real-estate is valuable, by definition, near the coast we develop every scrap of land possible, meaning that any amount of sea-level rise will affect someone: there is no such thing as inconsequential sea-level rise. It is just a question of how rapidly we will flood coastal property, how many people will be affected and at what rate, and how fast the cost will rise for tax payers who subsidize government-backed flood insurance.
On top of these smooth processes there may also be lurking hard-to-predict, abrupt events. If you have ever seen an unbroken ice-cycle sitting in a snow-bank in front of your house, you have clear evidence that glacier calving from the roof of your house does not always occur predictably and slowly: at some point melting ice-cycles break off and fall. Sometimes ice sheets let lose all at once, causing a sudden increase in ice flow. Such scenarios are not included in IPCC forecasts because they are difficult to predict. But there is plenty of evidence from the paleo record of rapid accelerations of ice loss … at a time when the climate was being forced only a fraction as fast as we are pushing it today.
The good news is that future sea-level rise will make the cheap property sitting back from the coast much more valuable, beach-front property.


